Phase 2 — Population Genomics
Nucleotide diversity (π) and PBS across 5 populations in the melanogenesis network
Overview
Phase 2 applies population genomic analyses to the 129-gene melanogenesis network using whole-genome variant data extracted for 5 populations:
| Population | N samples | Source |
|---|---|---|
| African | 747 | gnomAD HGDP+1KGP (YRI, LWK, ESN, GWD, MSL, Yoruba, Mandenka) |
| Melanesian | 47 | gnomAD HGDP (PapuanHighlands, PapuanSepik, Bougainville) + SGDP (Papuan) |
| South Asian | 790 | gnomAD HGDP+1KGP |
| East Asian | 718 | gnomAD HGDP+1KGP |
| European | 788 | gnomAD HGDP+1KGP (CEU, TSI, FIN, GBR, IBS + HGDP European) |
Two metrics are computed:
π (nucleotide diversity) — mean pairwise differences per base pair within each population, computed over each gene region (body ± 10 kb). Tests whether pigment-specific genes differ in within-population diversity.
PBS (Population Branch Statistic) — measures population-specific allele frequency change relative to two outgroups, using the Hudson FST estimator (Bhatia et al. 2013). Four approved scans:
| Scan | Target | Outgroup | Distant outgroup |
|---|---|---|---|
| PBS-1 | African | South Asian | Melanesian |
| PBS-2 | African | European | Melanesian |
| PBS-3 | Melanesian | South Asian | African |
| PBS-4 | Melanesian | European | African |
Note: PBS was computed within the 129-gene melanogenesis network only. Values represent relative differentiation within this candidate gene set and are not calibrated against a genome-wide null distribution.
Note: Output CSVs not yet generated. Run
analysis/phase2_pi_pbs_analysis.pyto produce figures and tables.
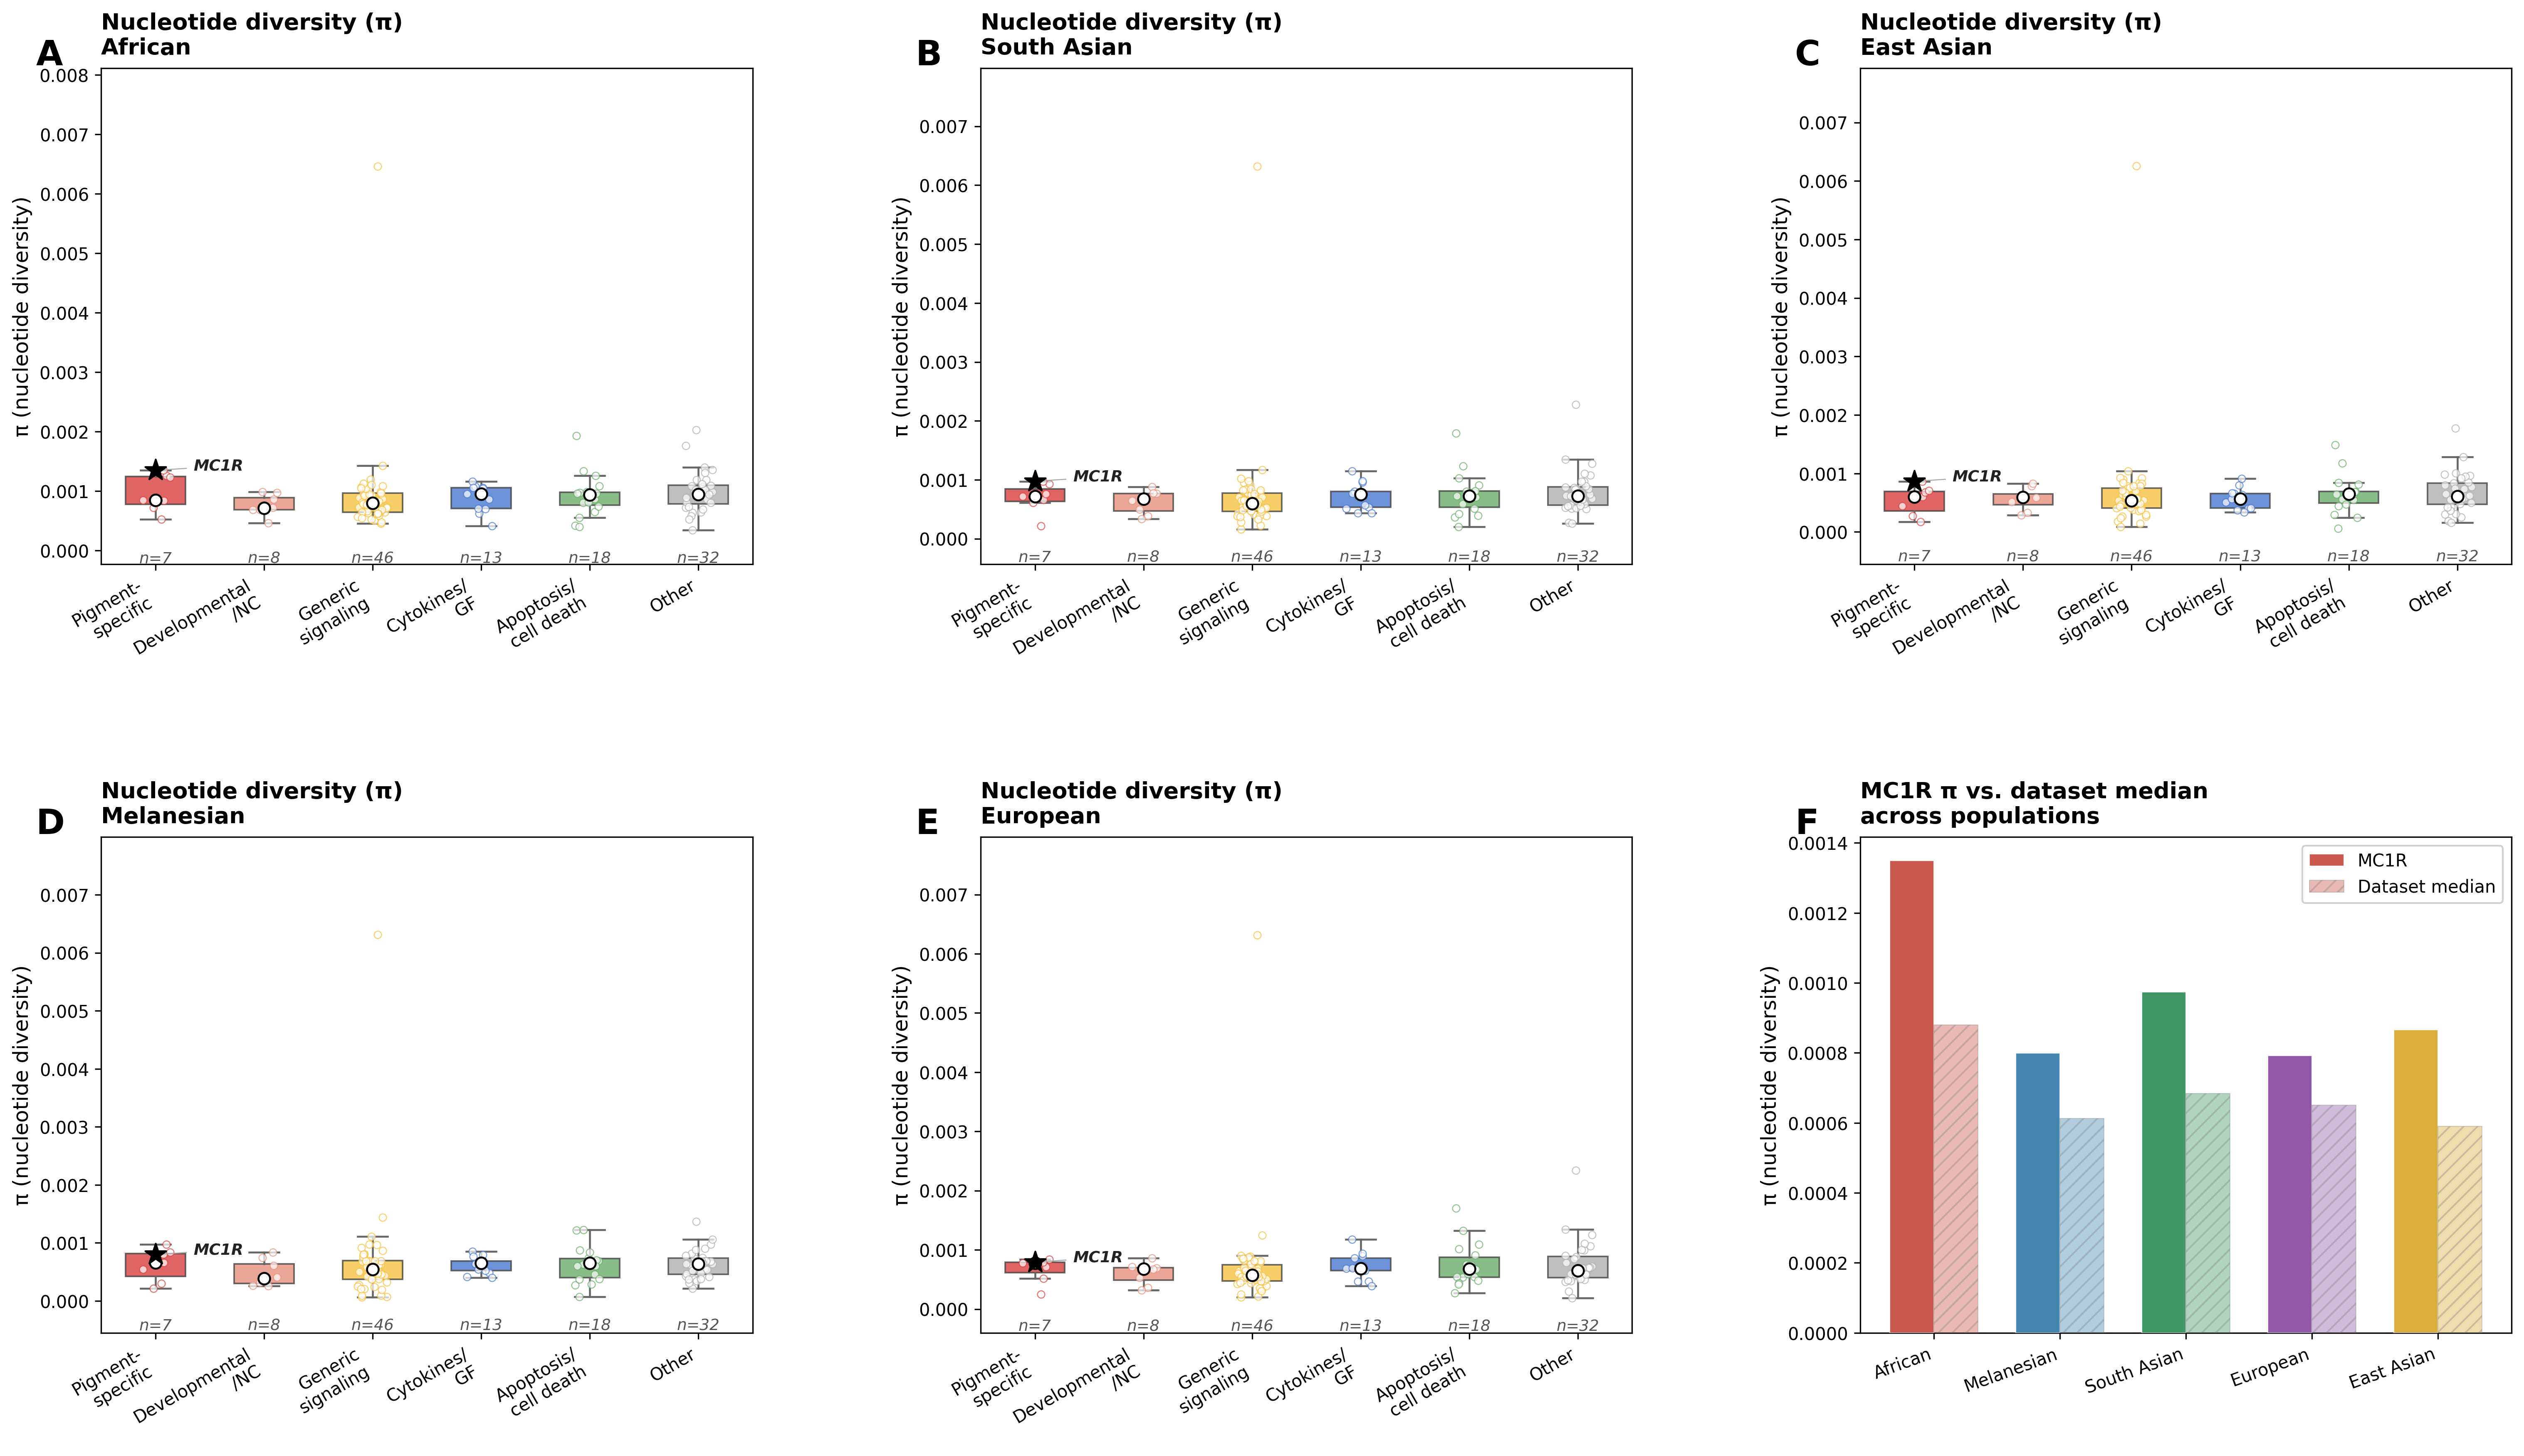
Phase 2.1 — Nucleotide diversity (π)
Figure — π by functional category, all 5 populations
Panels A–E show π distributions by functional category for each population. Median shown as a white open circle. MC1R is marked with a star (★) in each panel. Panel F shows MC1R π vs. the dataset median across all 5 populations.
π statistics
Table 1 — Pigment-specific gene π values (all populations)
Run `analysis/phase2_pi_pbs_analysis.py` to generate this table.Table 2 — Top 10 genes by π divergence across populations
Divergence = max(π) − min(π) across the 5 populations. High divergence indicates that selective pressures on within-population diversity differ substantially between populations at that locus.
Run `analysis/phase2_pi_pbs_analysis.py` to generate this table.MC1R π case study
Phase 2.2 — PBS (Population Branch Statistic)
Figure — PBS by functional category, all 4 scans
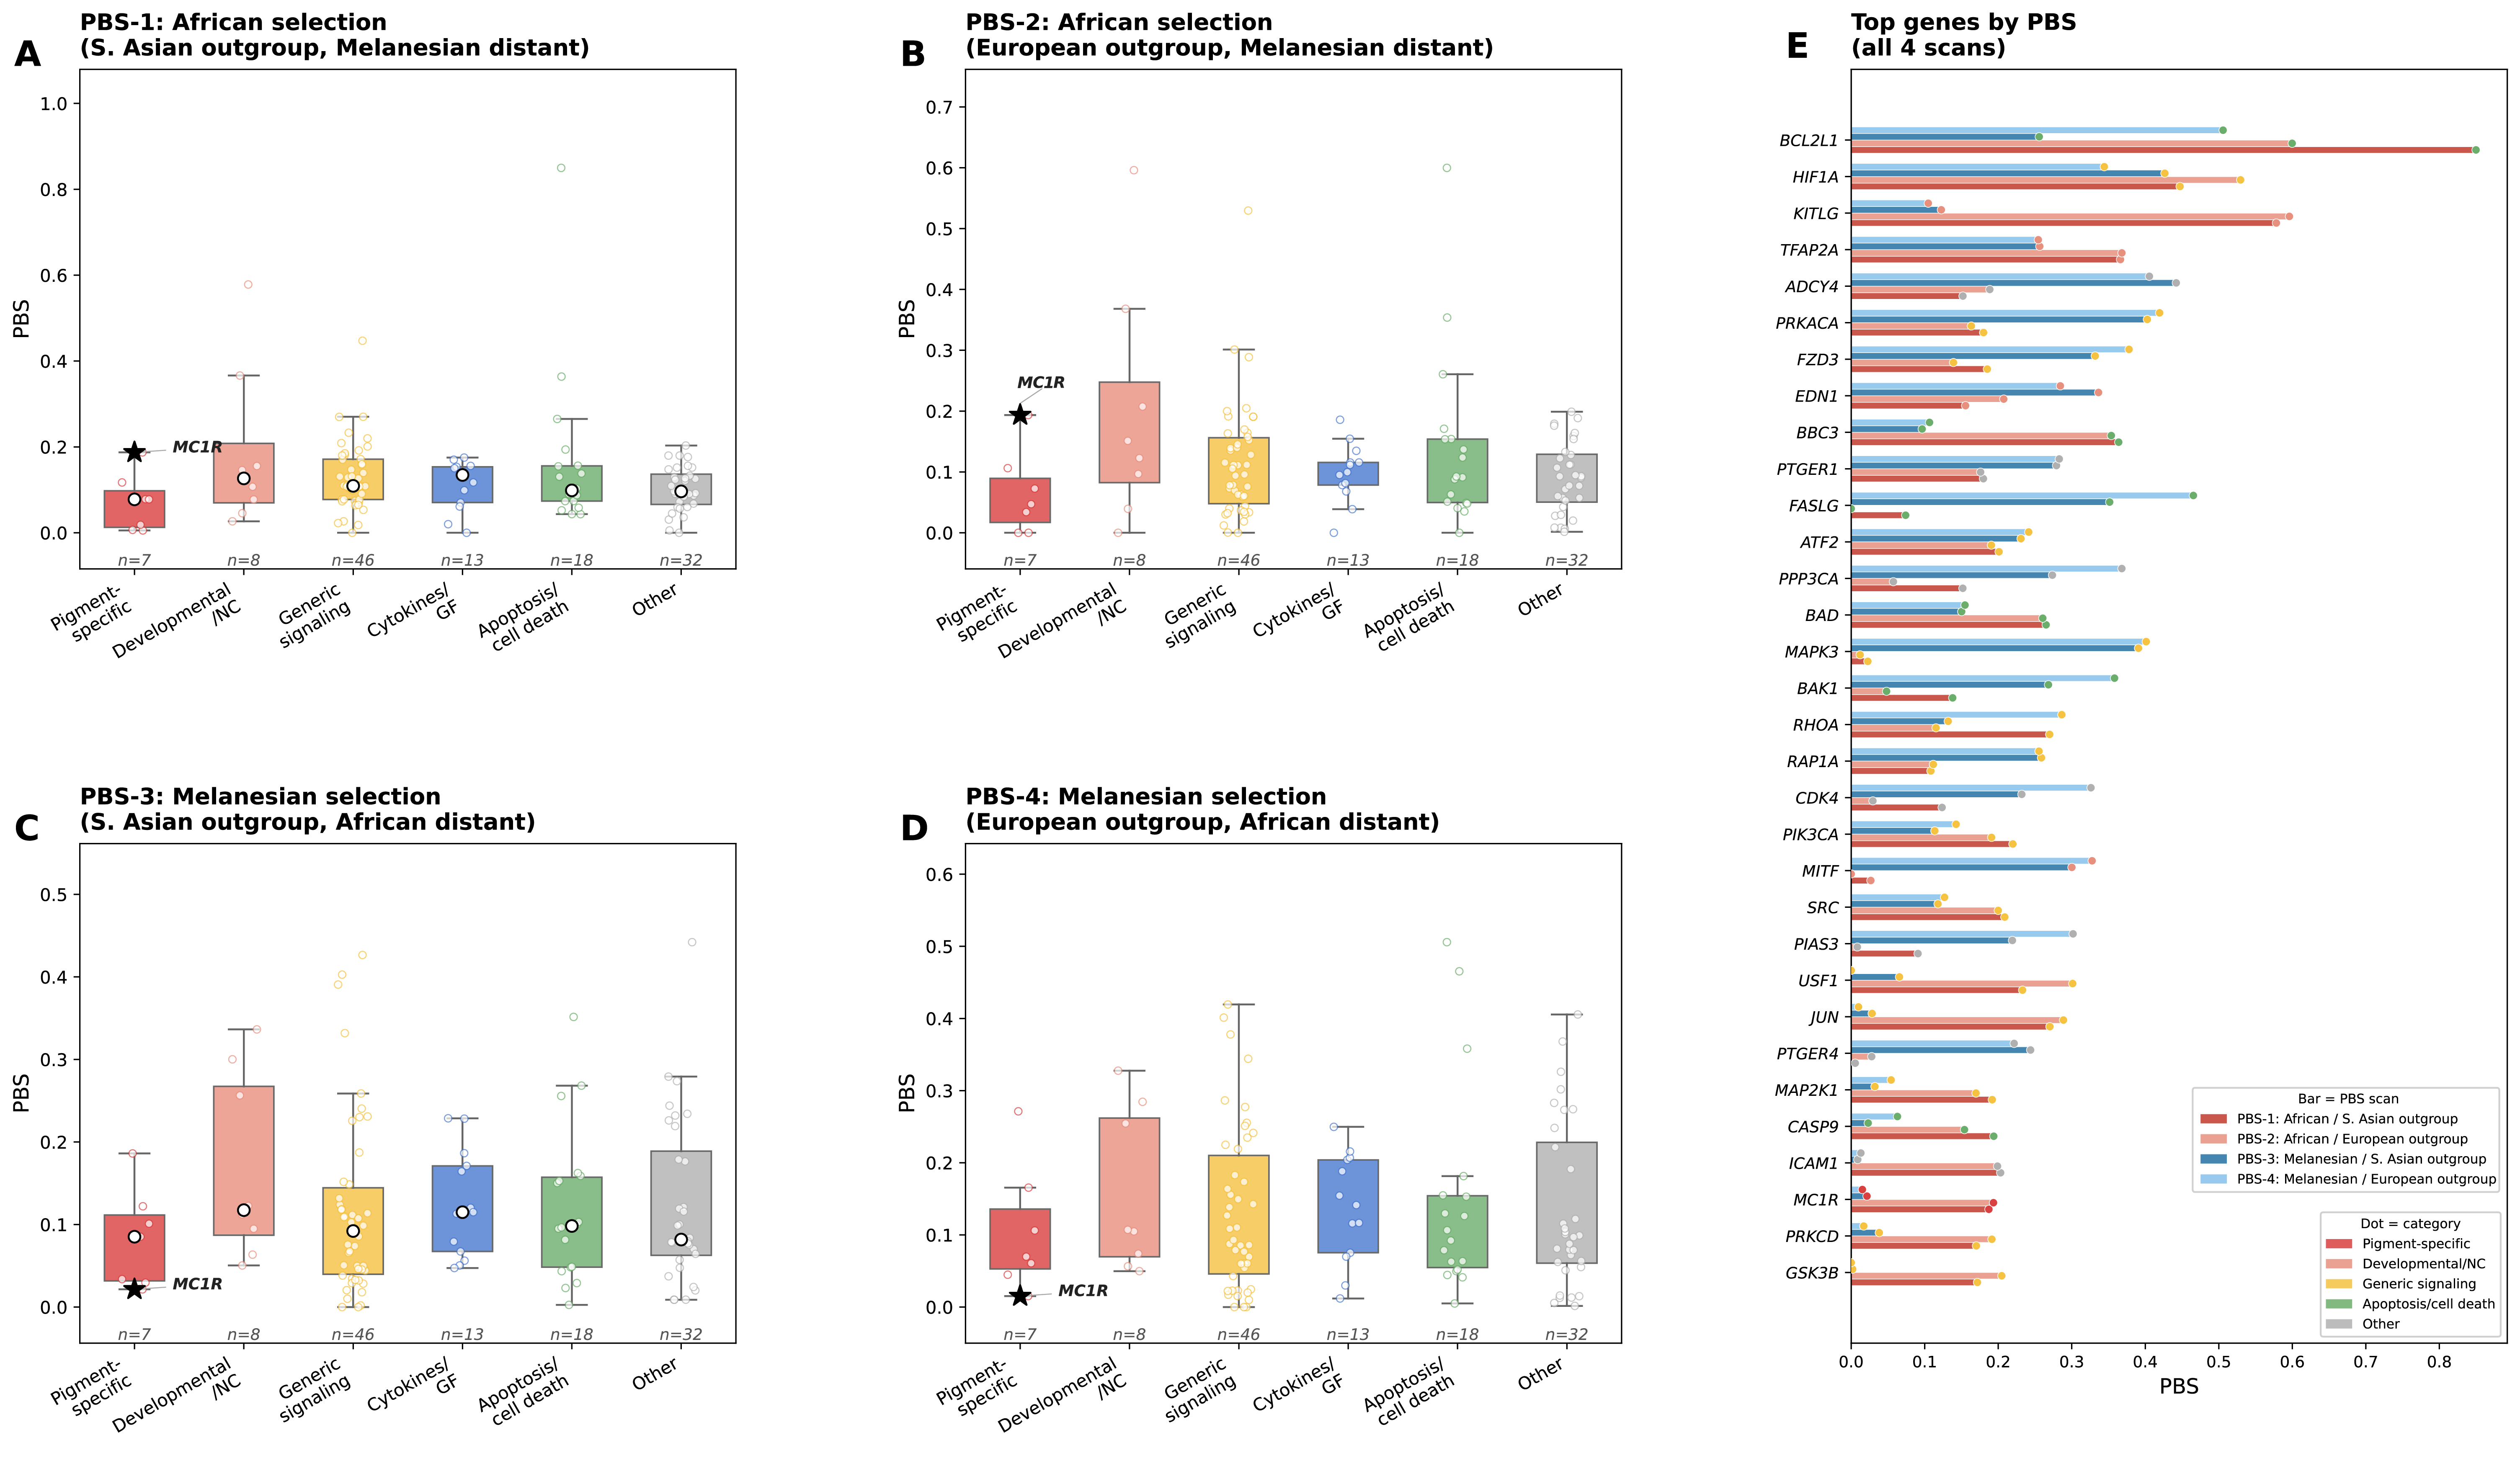
Panels A–D: PBS distributions by functional category for each scan. Panel E: top genes across all 4 scans (horizontal bars — dark red/salmon = African scans, dark blue/light blue = Melanesian scans; dot color = functional category).
Top 10 genes per PBS scan
MC1R PBS case study
Figure — PBS population branch trees
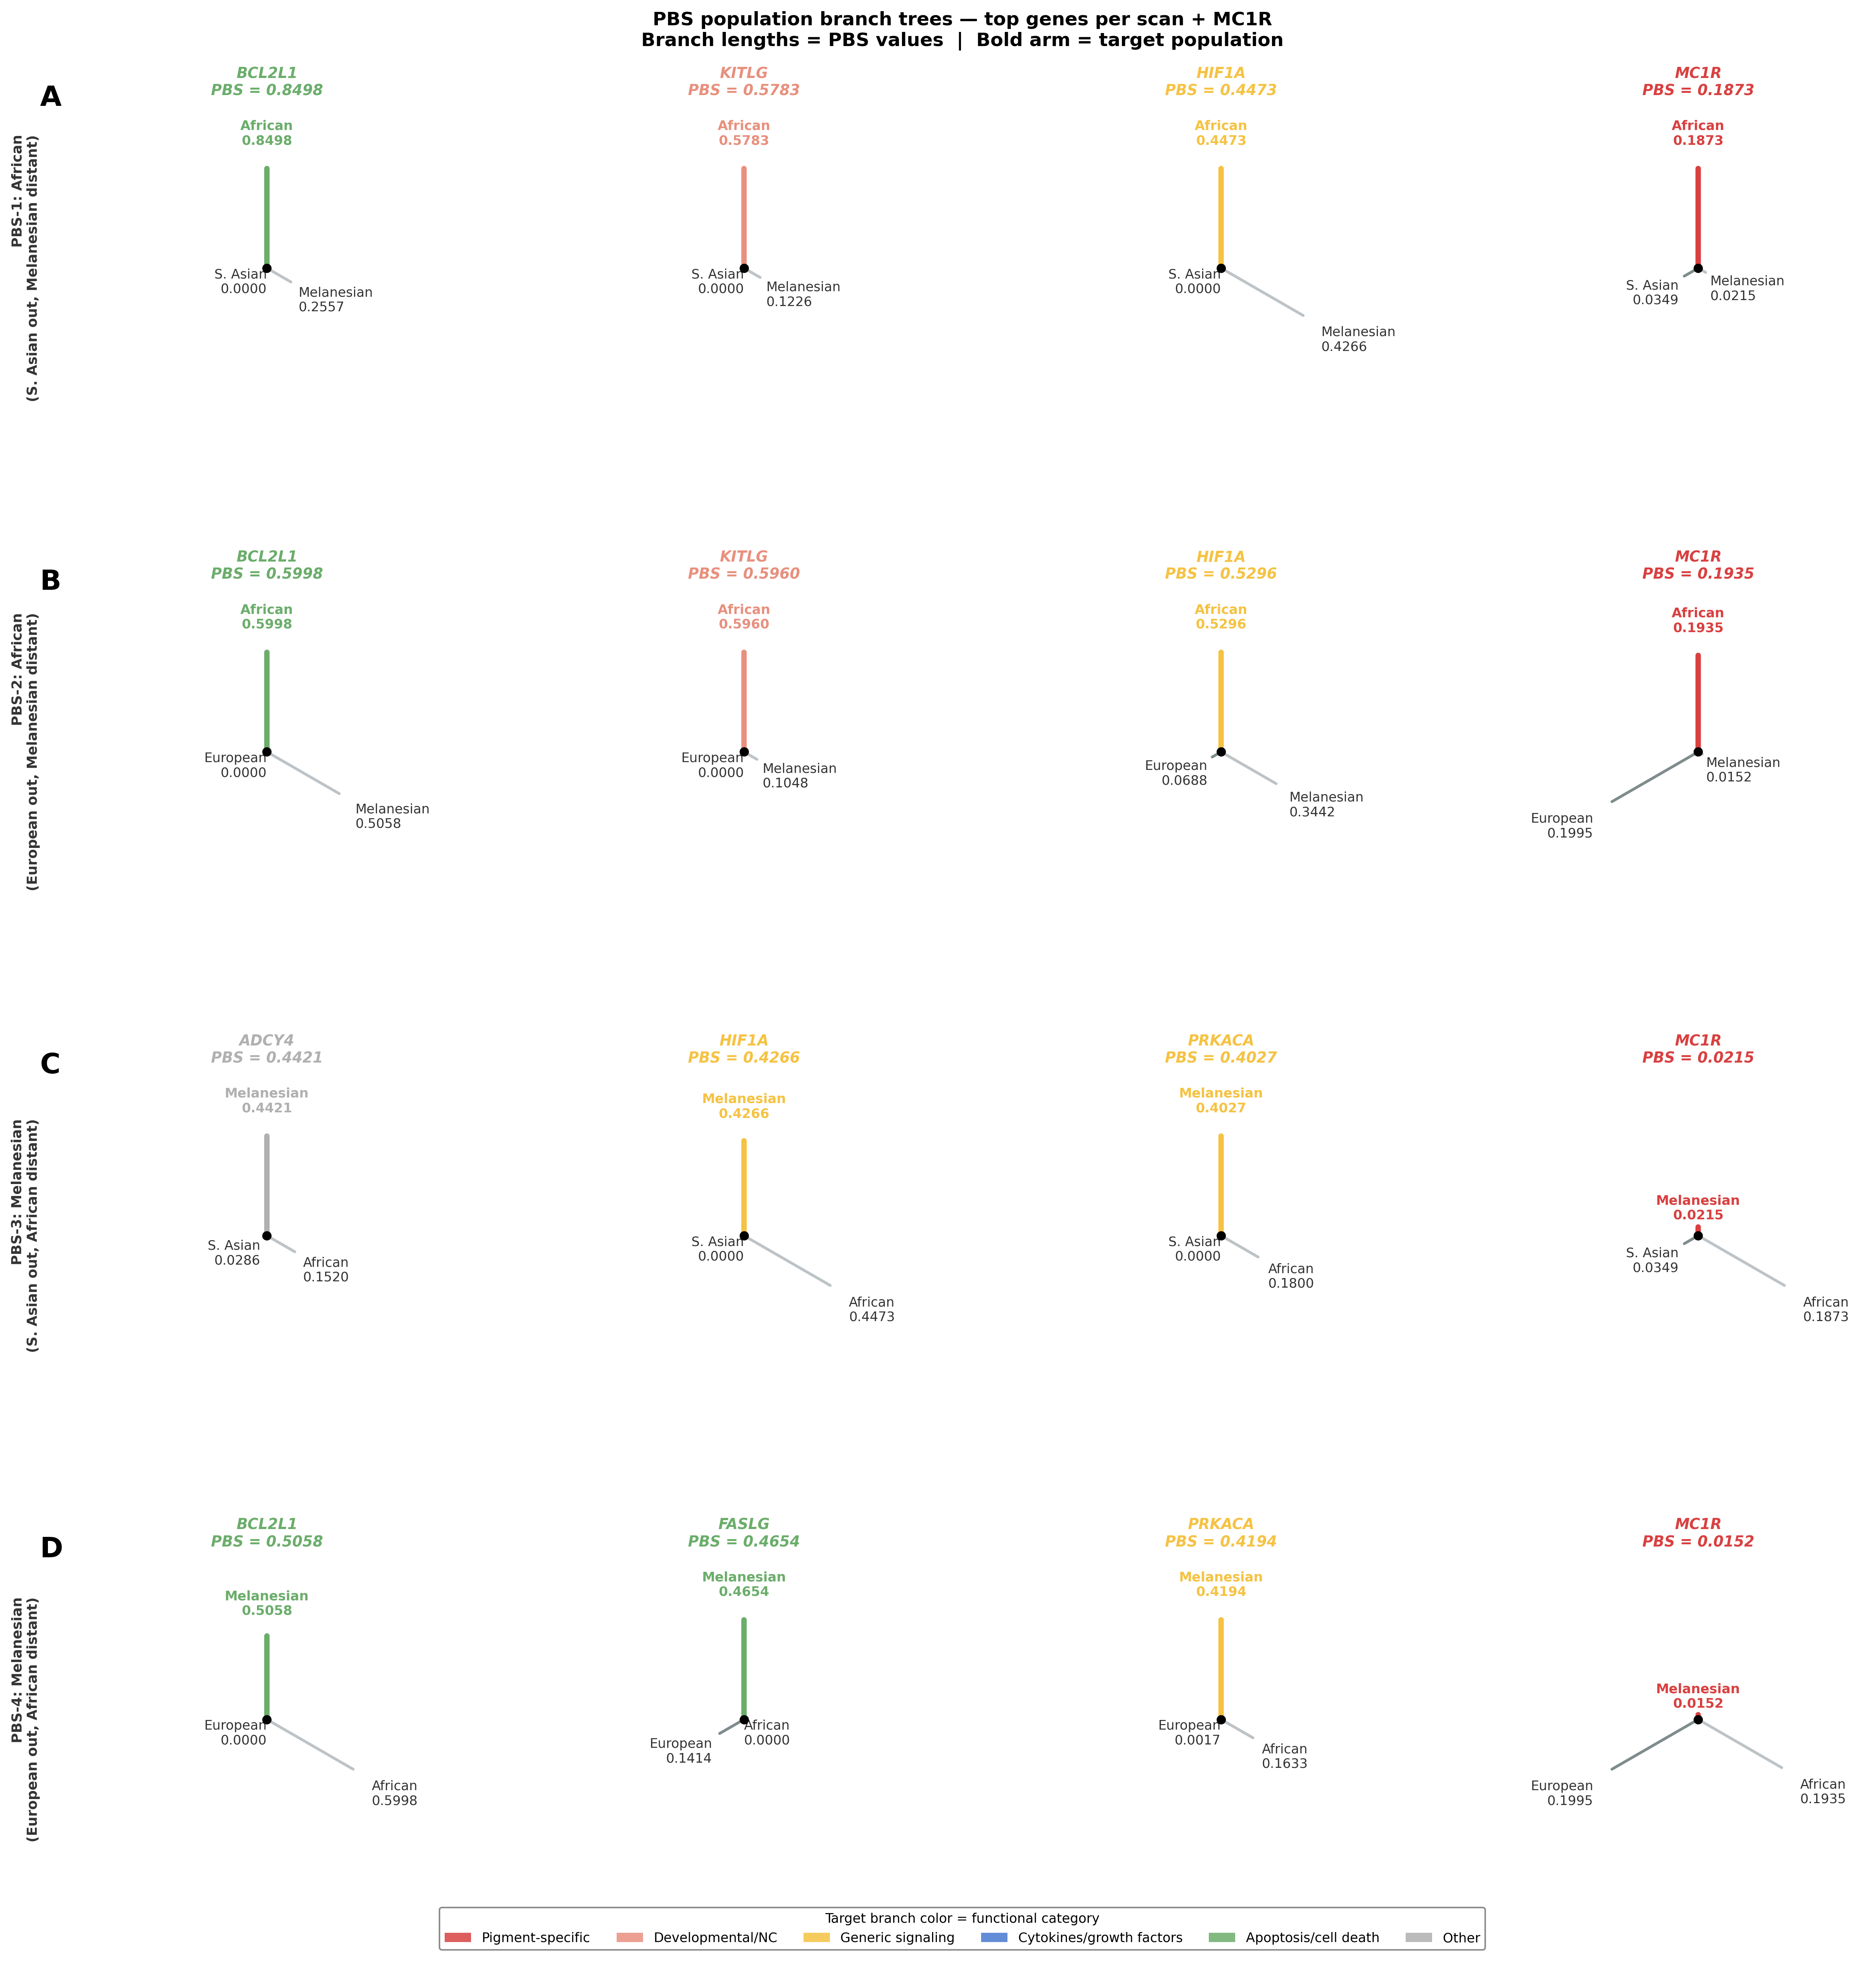
Each tree is an unrooted 3-leaf star where branch lengths are proportional to PBS values for the target, outgroup, and distant outgroup populations respectively. A long target arm with short outgroup arms indicates population-specific selection in the target population. The bold colored arm is the target; arm color reflects the gene’s functional category. The MC1R column is shaded yellow.
All branch lengths are derived from pairwise Hudson FST estimates: T = −ln(1 − FST), then PBS = (Ttarget–out + Ttarget–distant − Tout–distant) / 2.
Phase 2.3 — Cross-population PBS summary
Figure — African vs. Melanesian PBS (population-averaged)
Each of the 4 PBS scans is averaged by target population to reduce outgroup noise: mean_afr = (PBS-1 + PBS-2) / 2 and mean_mel = (PBS-3 + PBS-4) / 2. Threshold lines mark the 75th percentile of each axis, dividing genes into four quadrants.
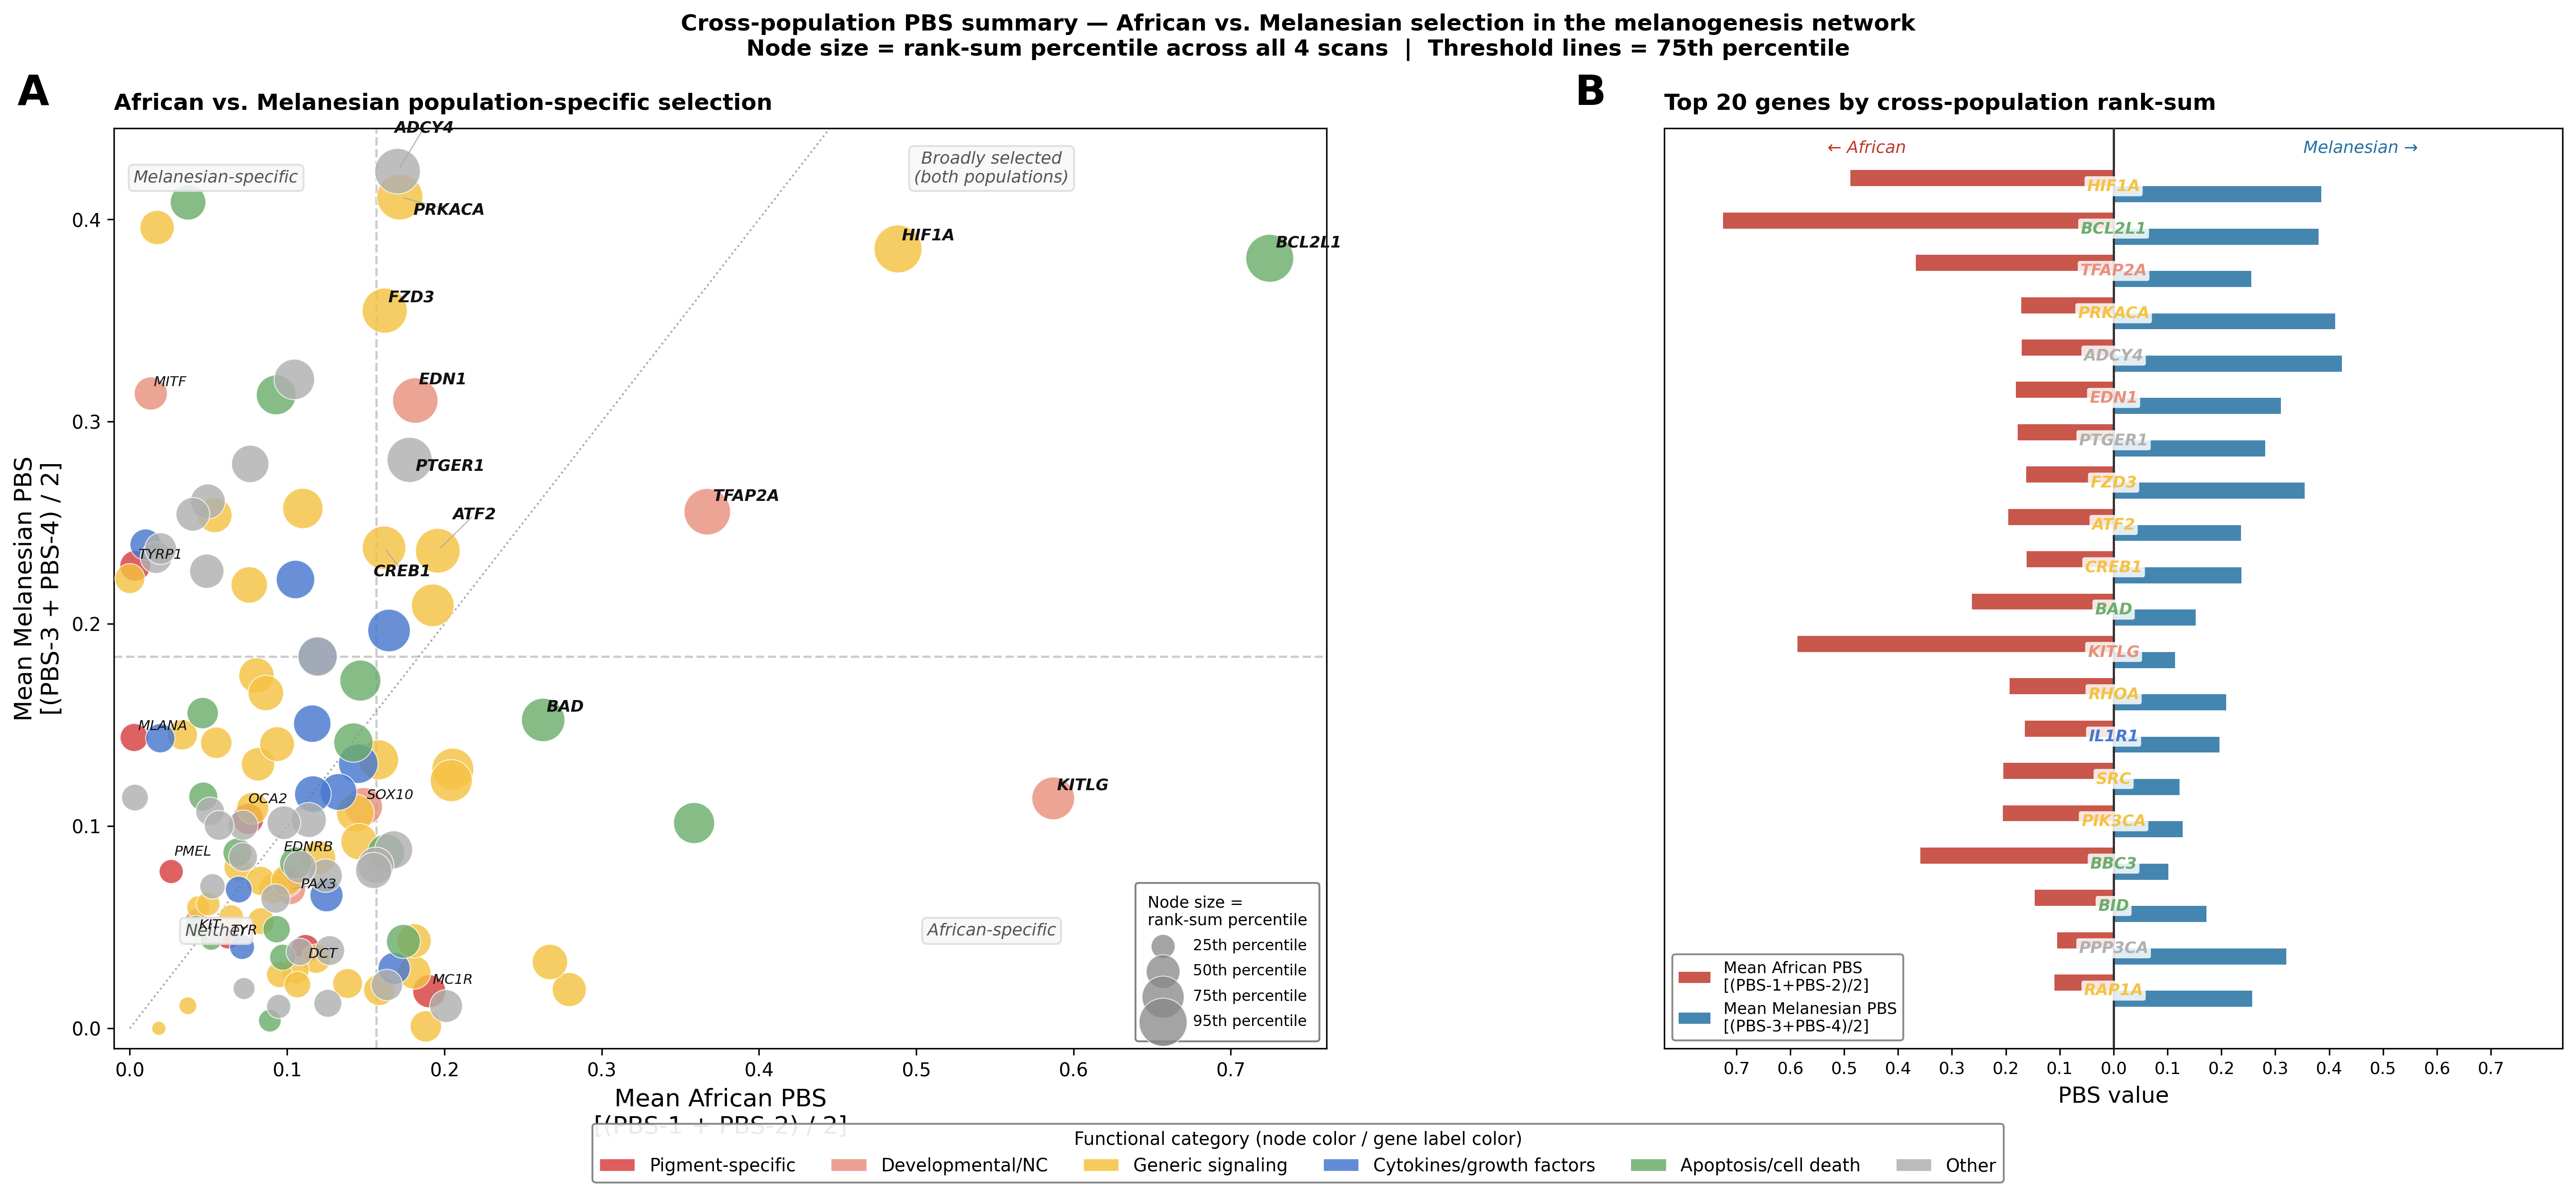
Panel A — 2-D scatter. Node size reflects rank-sum percentile across all 4 scans (larger = more consistently elevated across scans). The dotted diagonal marks equal signal in both populations; genes above it are Melanesian-dominant, genes below are African-dominant.
Panel B — Top 20 genes by cross-population rank-sum. African signal extends left (red), Melanesian signal extends right (blue). Gene label color = functional category.
Phase 2.4 — Network position vs. population-specific selection
Figure — Betweenness centrality × KEGG connectivity, node size = PBS
This figure directly tests the central question: Do population-specific selection signatures concentrate at peripheral network positions, while core pathway genes remain universally constrained?
X-axis = cross-system connectivity (KEGG pathway count); Y-axis = within-pathway centrality (betweenness centrality). Node size is proportional to PBS value — larger nodes carry stronger population-specific selection signals. Node color = functional category.
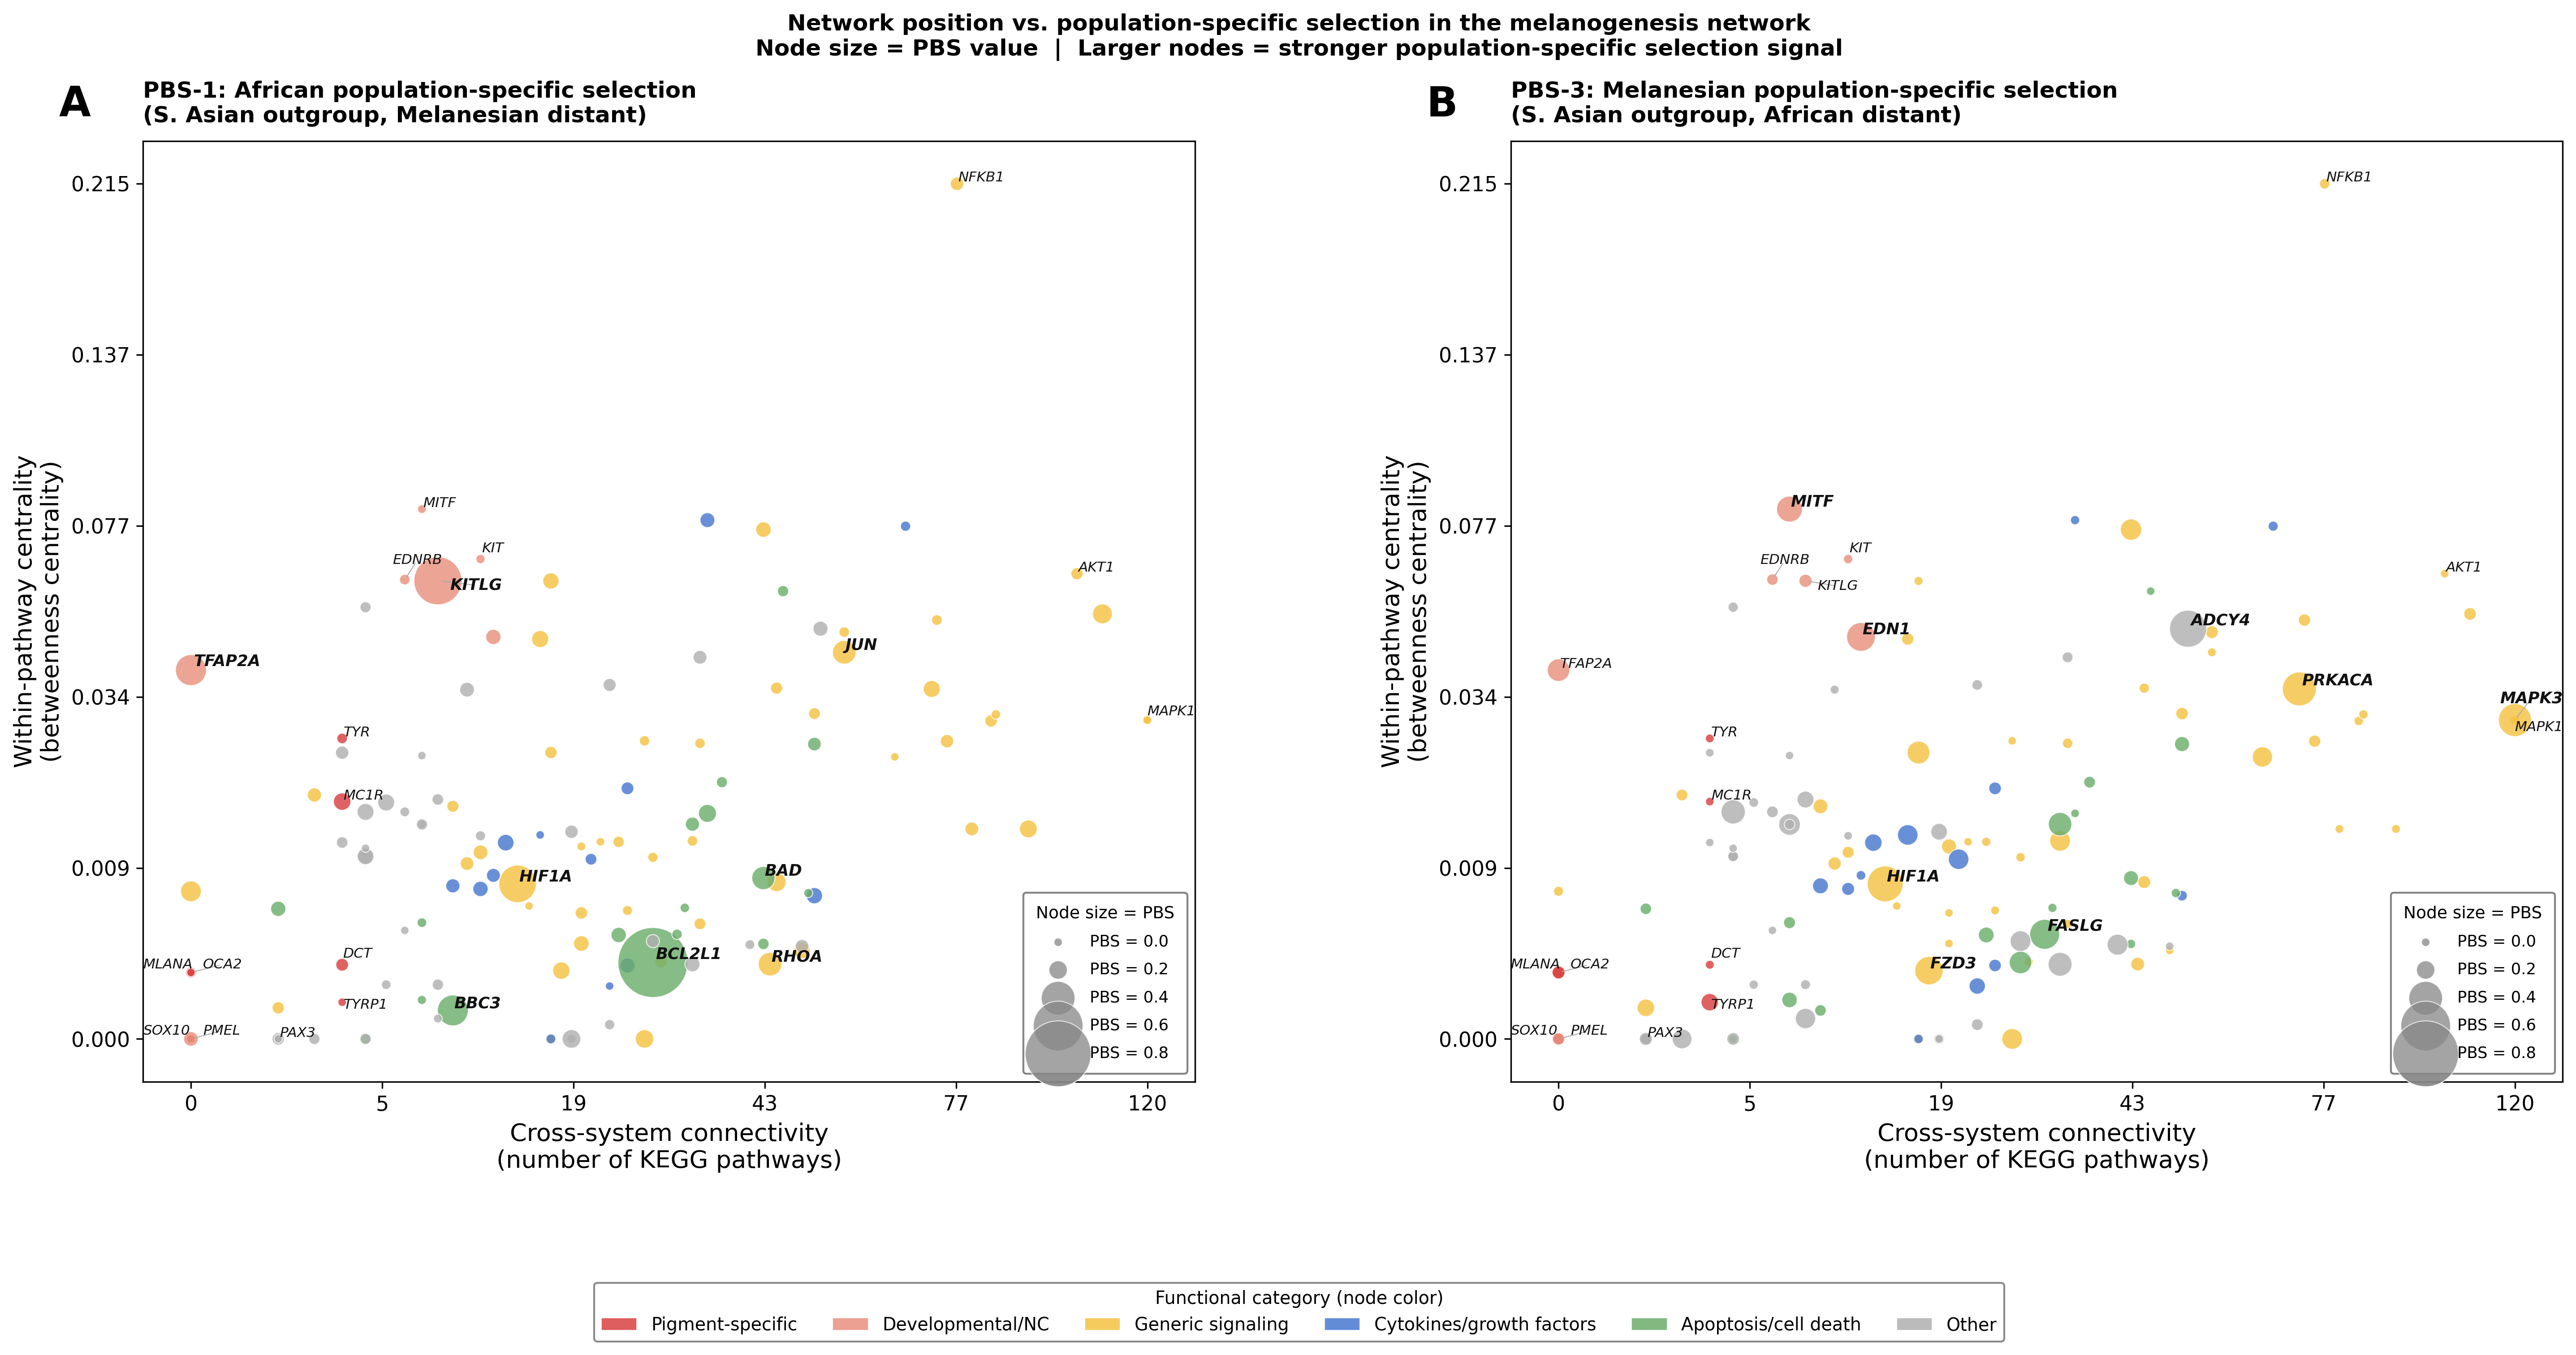
Panel A — PBS-1: African population-specific selection (S. Asian outgroup, Melanesian distant). BCL2L1 carries the largest signal (PBS = 0.85) at a peripheral position (low betweenness, moderate KEGG count). KITLG and TFAP2A are the next-highest African signals among Developmental/NC genes.
Panel B — PBS-3: Melanesian population-specific selection (S. Asian outgroup, African distant). Signals spread more evenly across network positions: MAPK3 sits in the pleiotropic hub corner (KEGG = 120), while ADCY4 and HIF1A carry moderate-to-high signals at intermediate positions. MITF (KEGG = 7, moderate betweenness) stands out as the highest-PBS pigment- specific gene in the Melanesian scan.
Spearman ρ (PBS × network position):
Run analysis scripts to generate network position × PBS statistics.Neither PBS scan shows a significant positive concentration at peripheral positions (ρ ≈ 0, p > 0.1). The African signal (BCL2L1) is peripheral but is an apoptosis gene rather than a pigment-specific gene. The result suggests that population-specific selection in the melanogenesis network does not systematically target peripheral specialists over pleiotropic hubs — selection signals reflect function-specific evolutionary pressures rather than network topology.
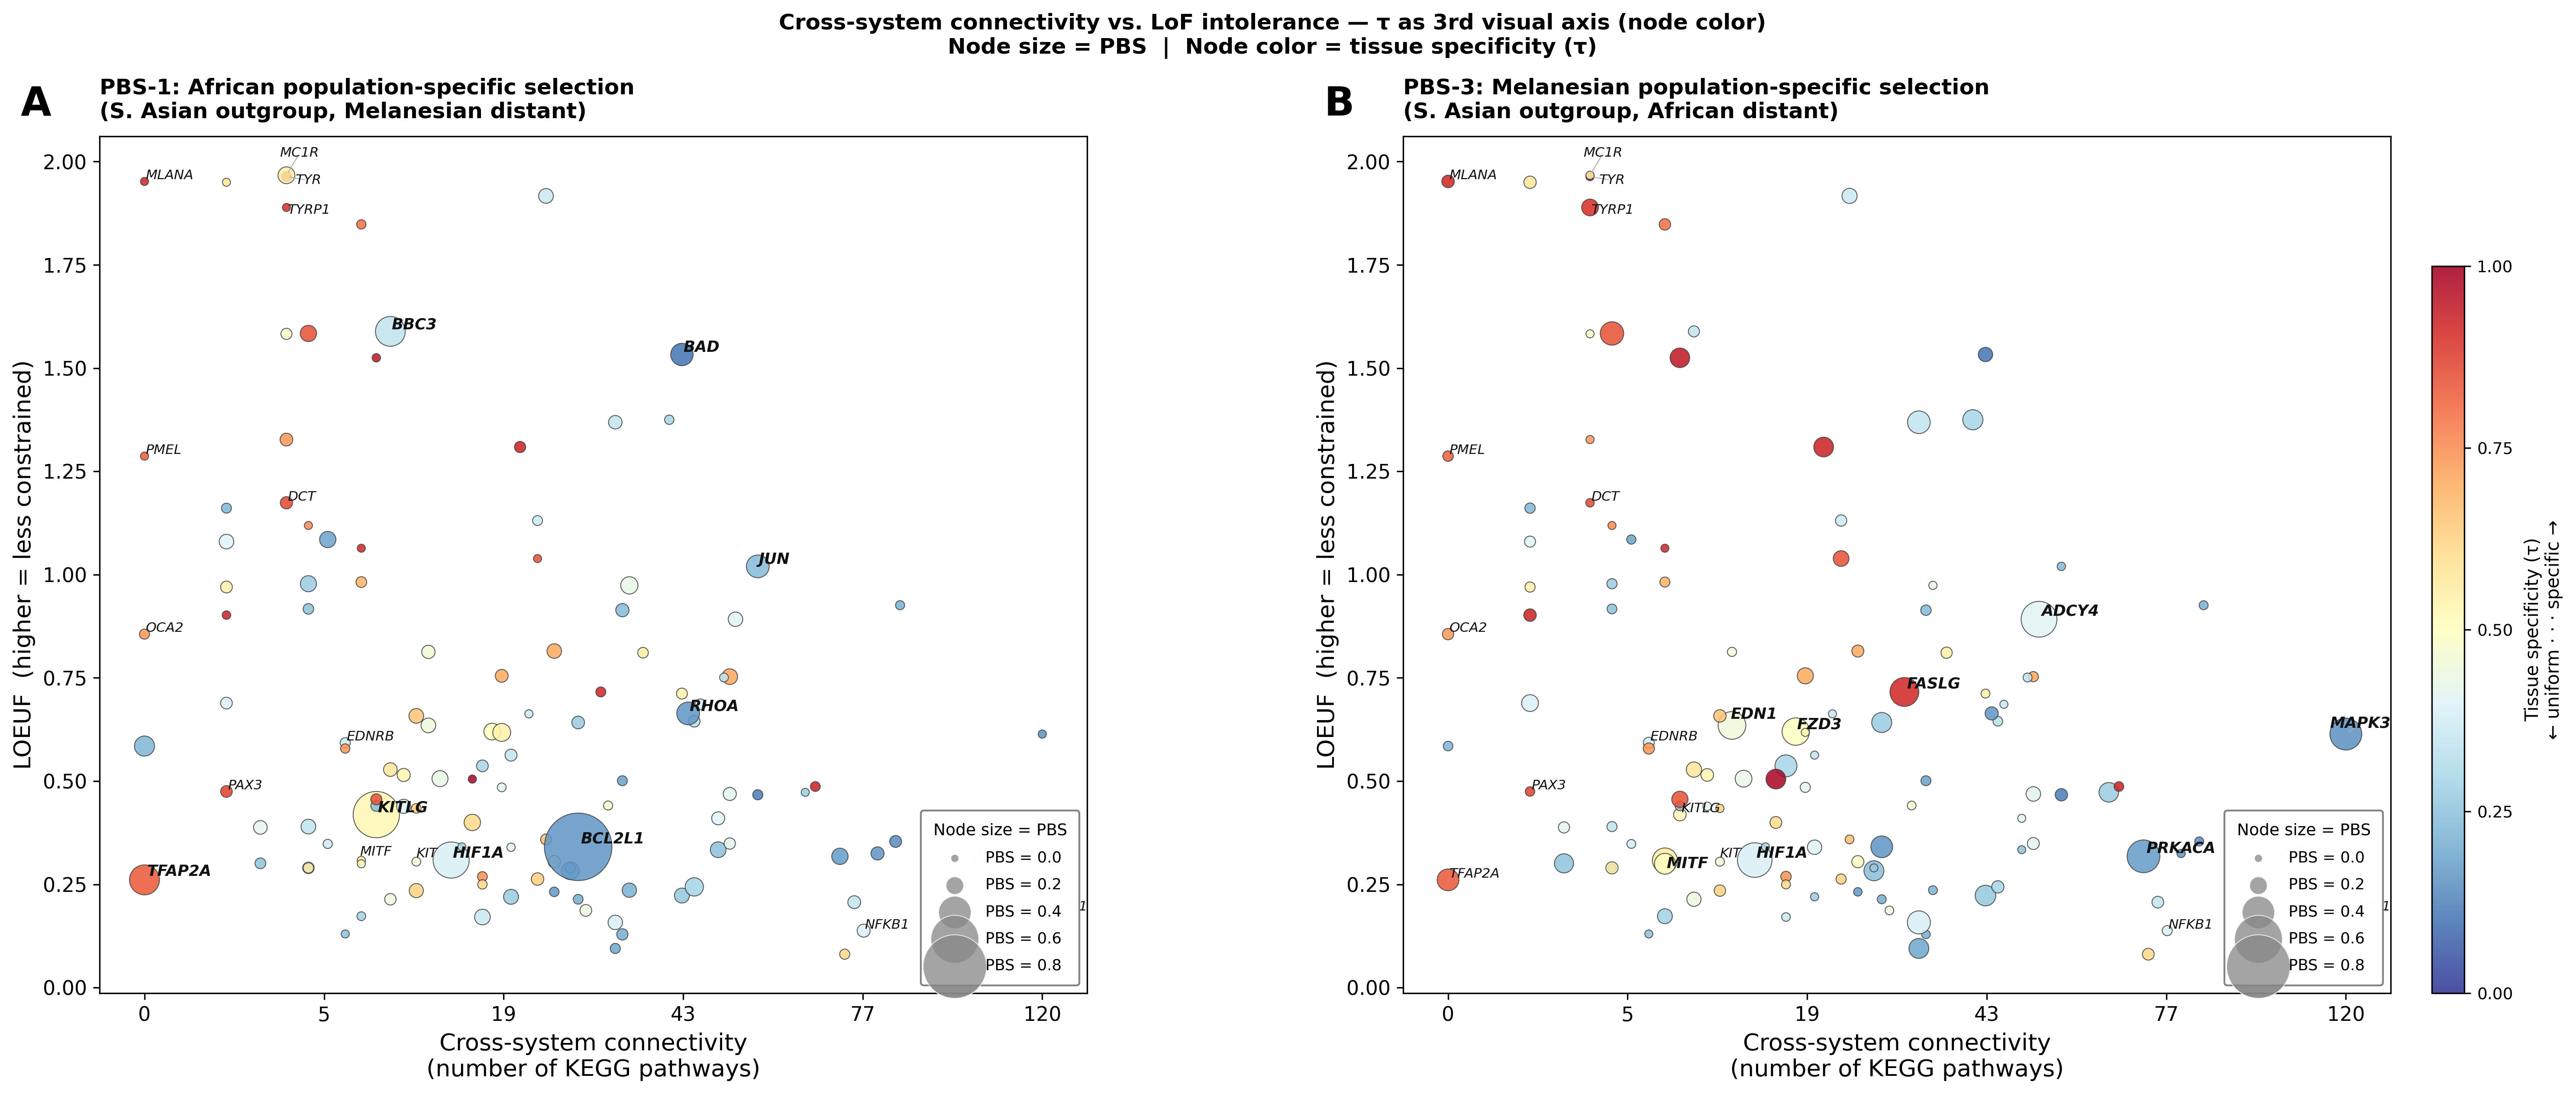
Phase 2.5 — LoF intolerance vs. population-specific selection
Figure — LoF intolerance × KEGG connectivity, node size = PBS
Complementary analysis to Phase 2.4: Does population-specific selection target constrained or tolerated genes?
X-axis = cross-system connectivity (KEGG pathway count); Y-axis = LOEUF (higher = less constrained). Node size is proportional to PBS value — larger nodes carry stronger population-specific selection signals. Node color = functional category.
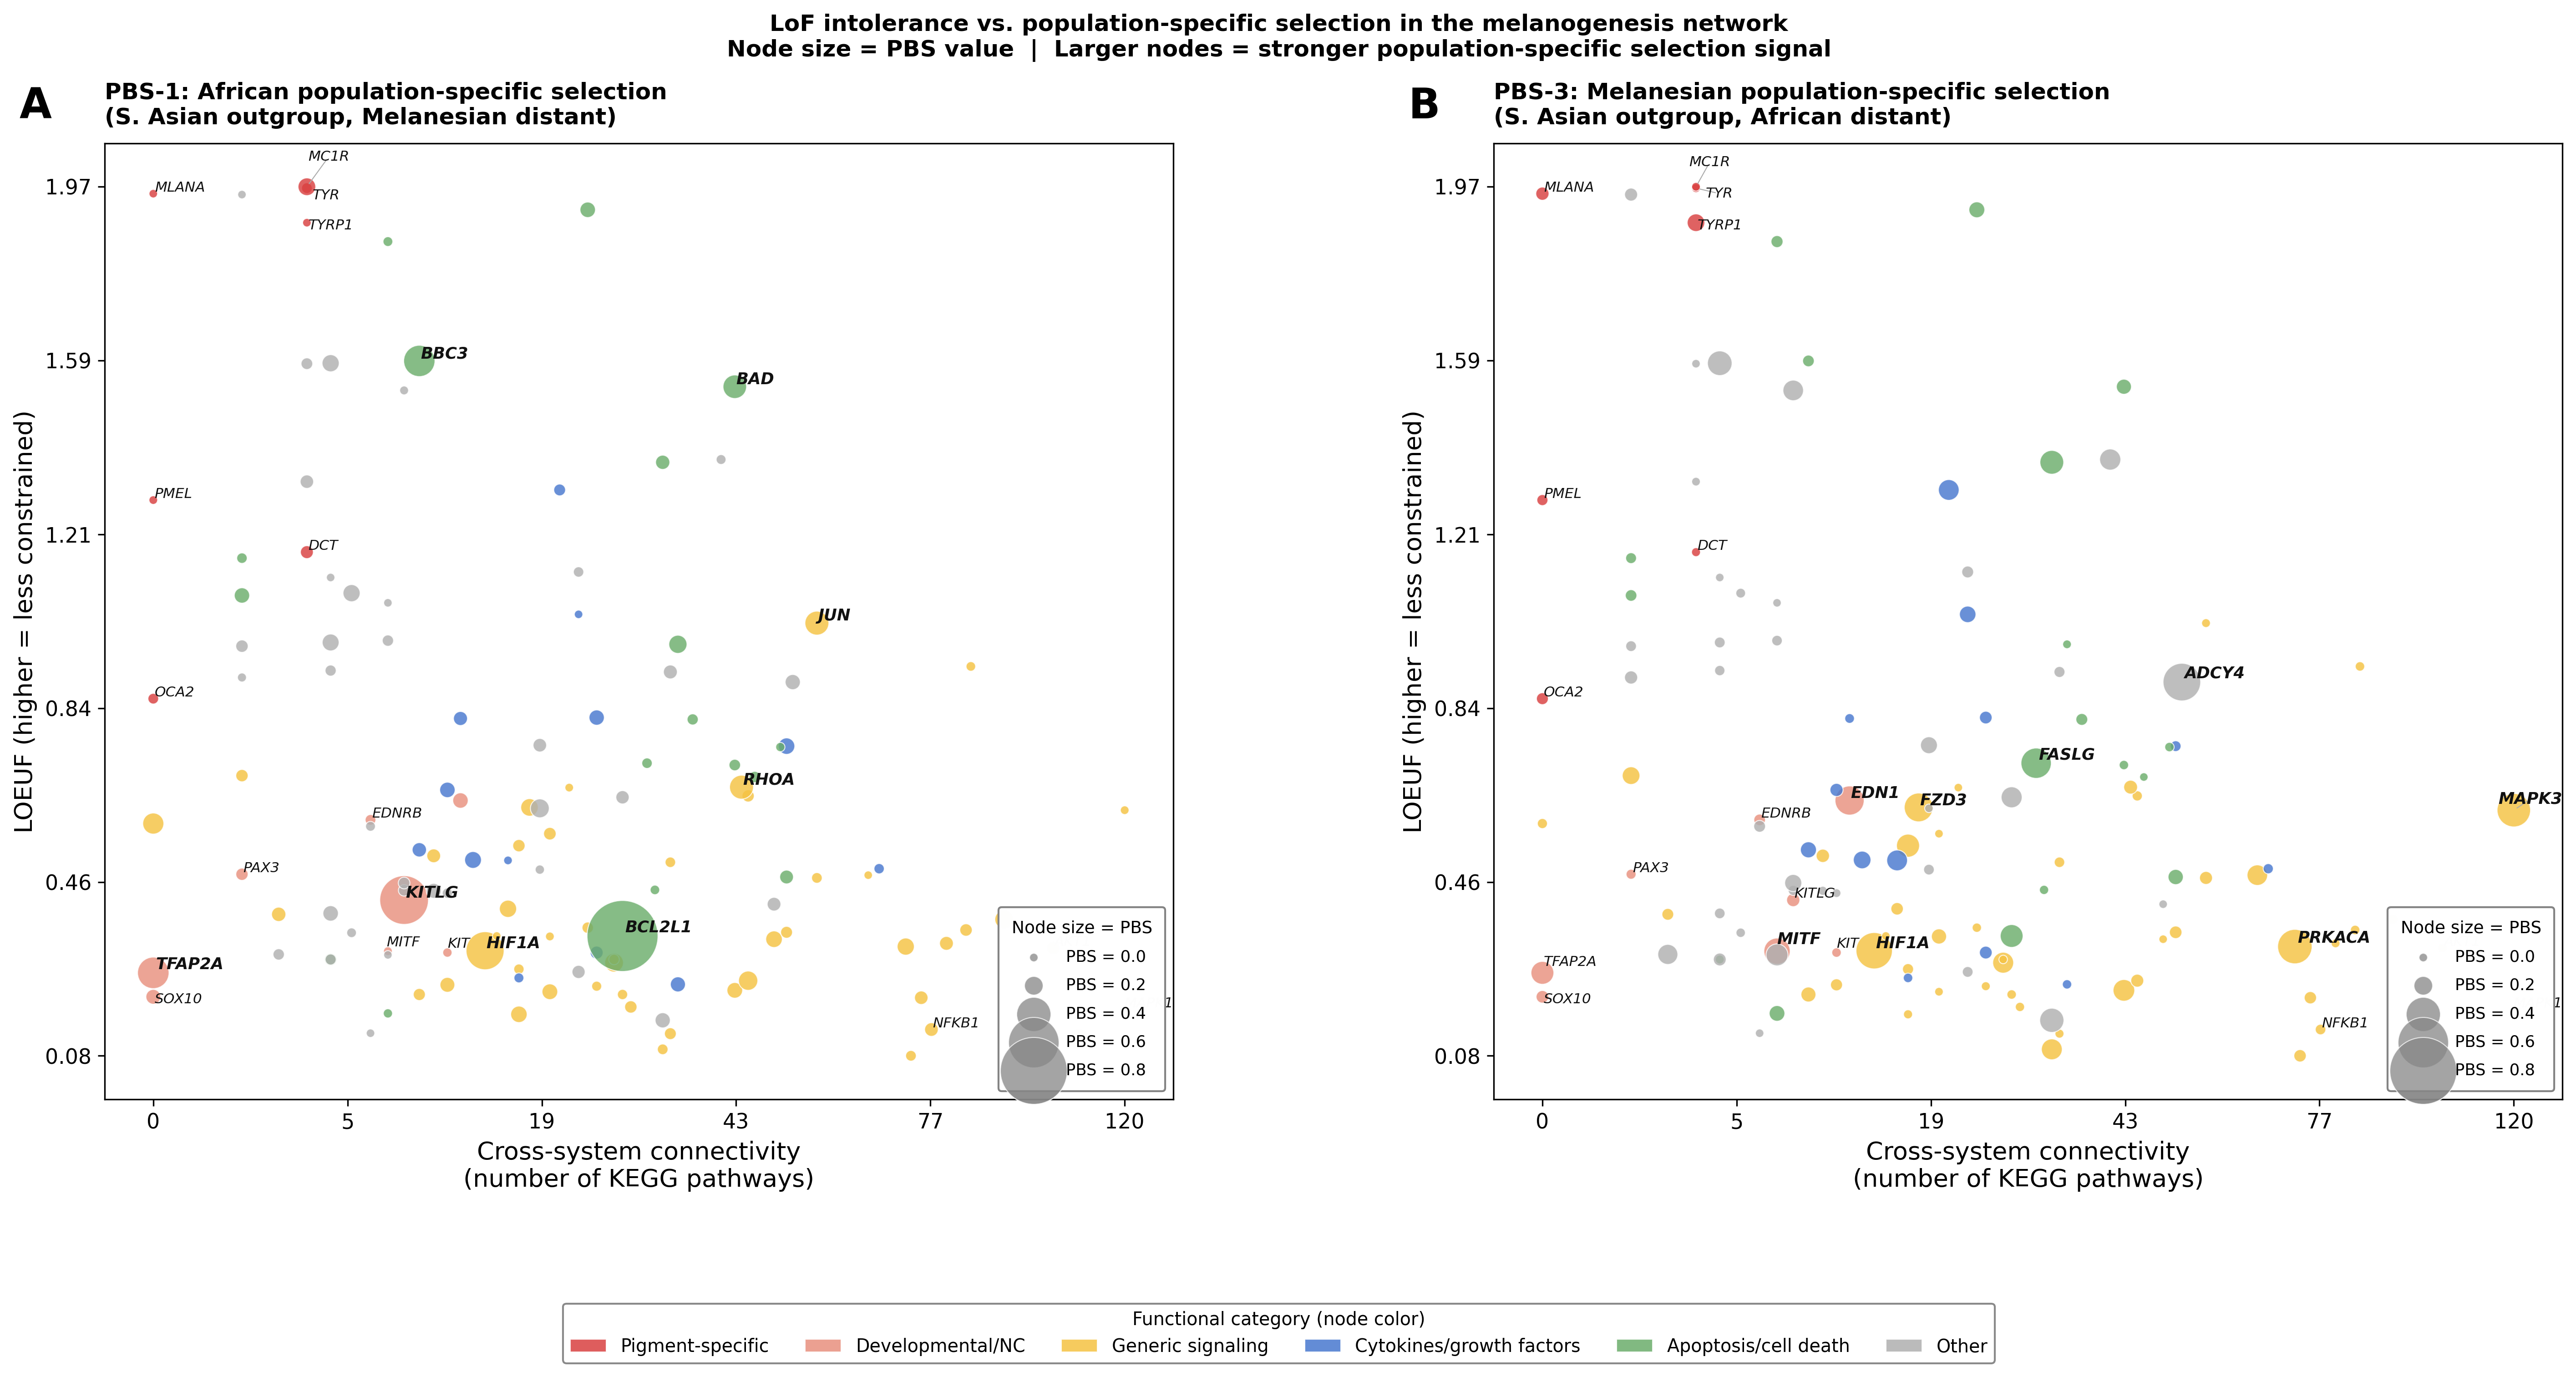
Panel A — PBS-1: African population-specific selection. BCL2L1 (LOEUF = 0.34, highly constrained) carries the largest African signal at moderate connectivity. Genes like JUN and BAD show high PBS with high LOEUF (tolerated missense variants), suggesting functional variants under selection.
Panel B — PBS-3: Melanesian population-specific selection. Selected genes span the full constraint spectrum — ADCY4 and PRKACA are tolerated (high LOEUF), while MITF is constrained (LOEUF = 0.31). MAPK3 is a pleiotropic hub (KEGG = 120) with moderate constraint (LOEUF = 0.61).
Spearman ρ (PBS × constraint):
Run analysis scripts to generate LoF intolerance × PBS statistics.Neither PBS scan shows a significant correlation with LOEUF (ρ ≈ 0). This suggests that population-specific selection acts on both constrained and tolerated genes, with selection drivers reflecting function-specific evolutionary pressures (e.g., pigment biology, metabolism) rather than global network-level constraint patterns.
Phase 2.6 — Tissue specificity (τ) variants
Tau (τ) from GTEx v8 replaces or supplements KEGG pathway count as an expression-based constraint axis. τ = 0 means uniformly expressed across all 54 tissues (housekeeping); τ = 1 means expressed in only one tissue. Source: analysis/phase2_tau_variants.py.
Figure A — Tissue specificity × LoF intolerance, node size = PBS
X-axis = τ (tissue specificity); Y-axis = LOEUF. Tests whether the tissue-specificity gradient (from GTEx) also stratifies population-specific selection. Spearman ρ(τ, LOEUF) = 0.342, p = 7.9×10⁻⁵: tissue-specific genes are systematically less LoF-intolerant than broadly expressed housekeeping genes.
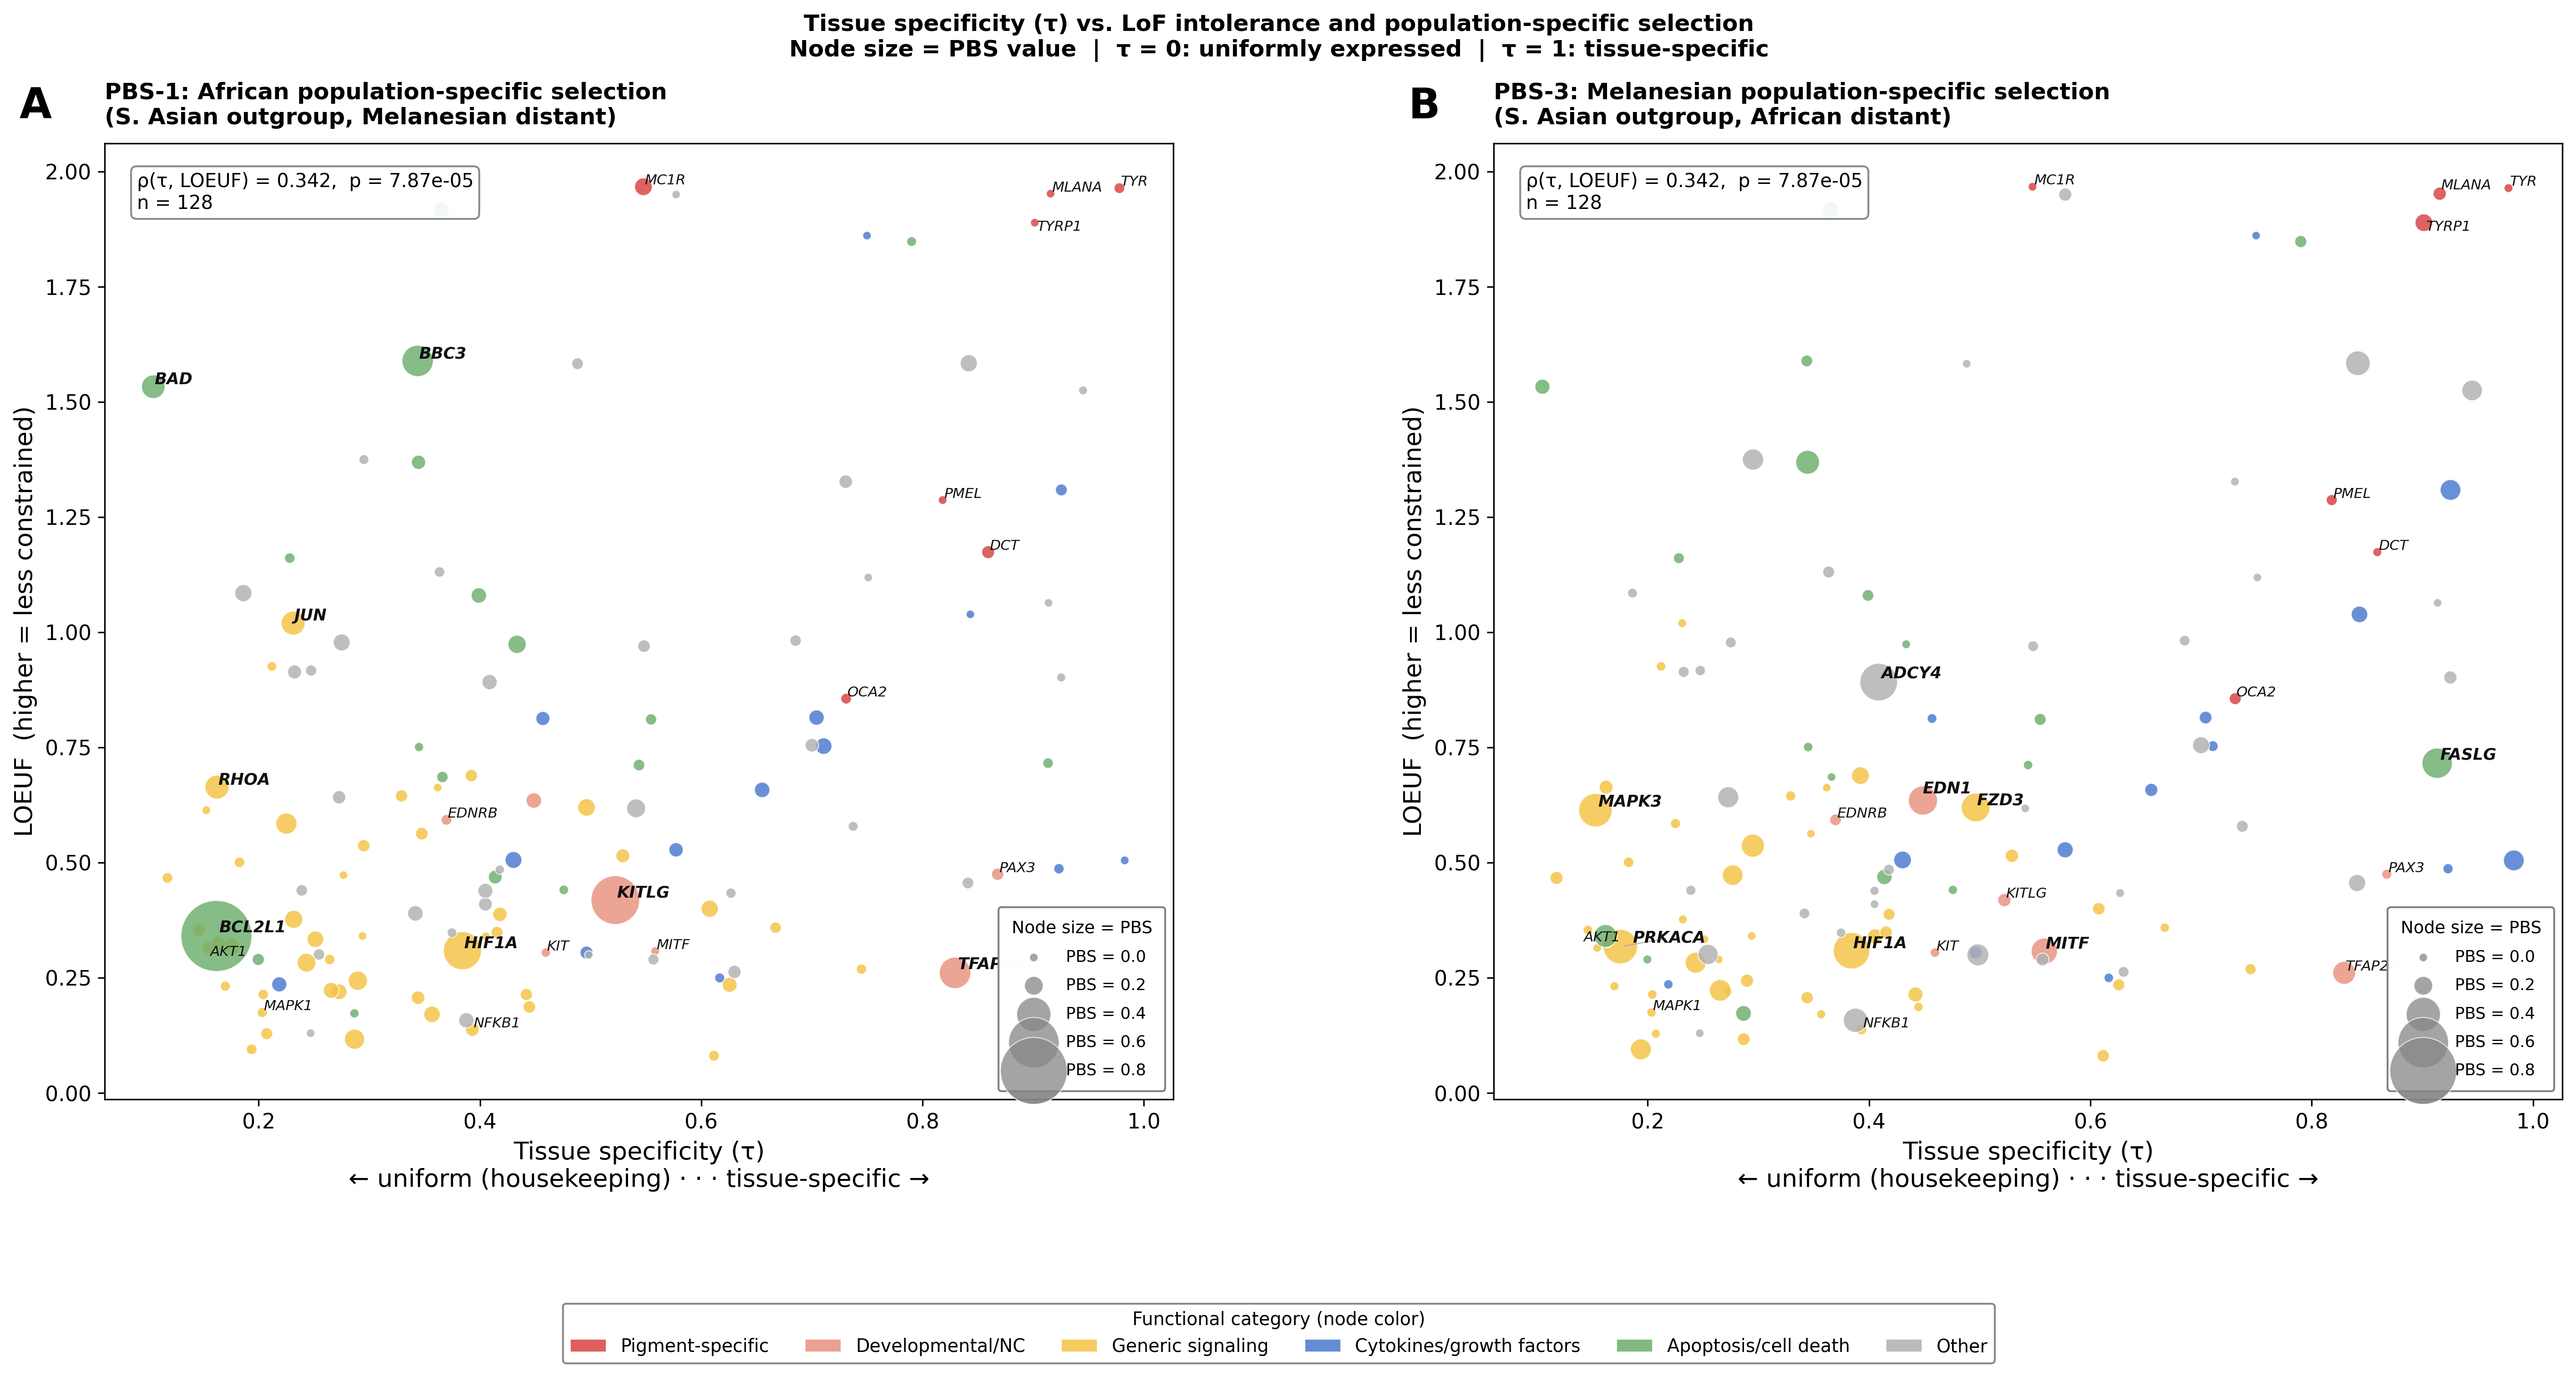
Figure B — Tissue specificity × within-pathway centrality, node size = PBS
X-axis = τ; Y-axis = betweenness centrality. Tests whether network position (hub vs. peripheral) also tracks tissue-specificity. Spearman ρ(τ, betweenness) = −0.158, p = 0.076: weak trend only — housekeeping genes tend toward slightly higher centrality but the relationship is not significant, suggesting tissue-specificity and network topology are largely independent axes.
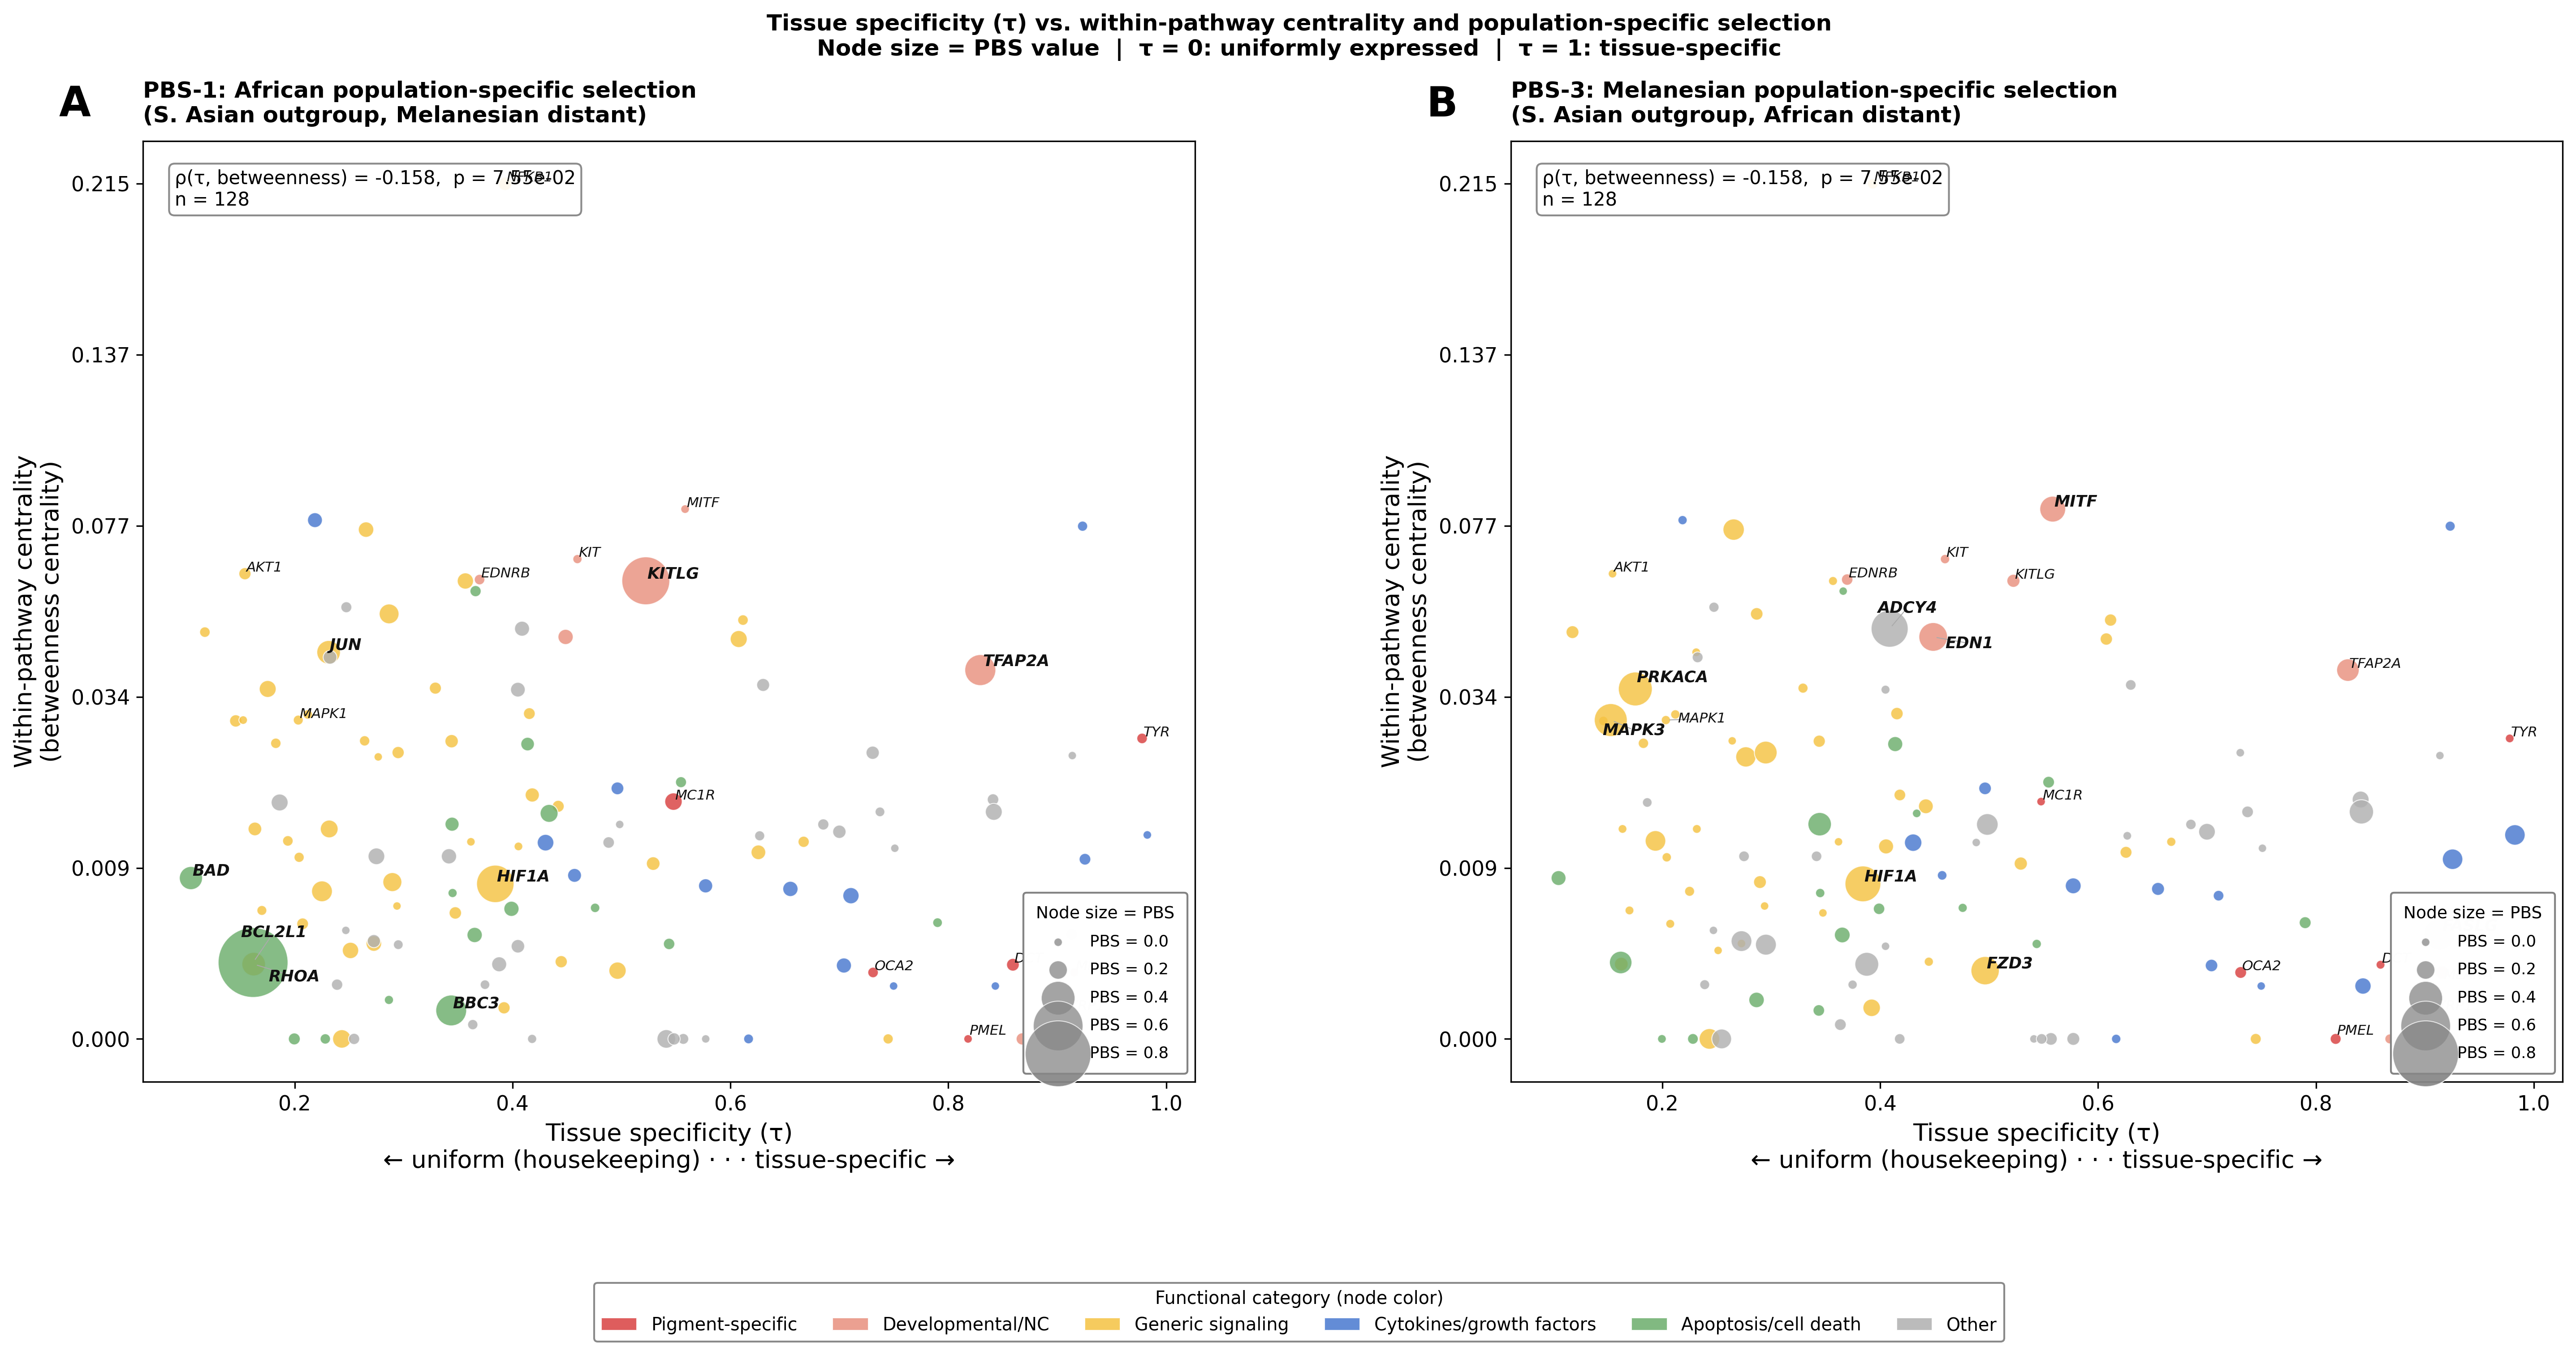
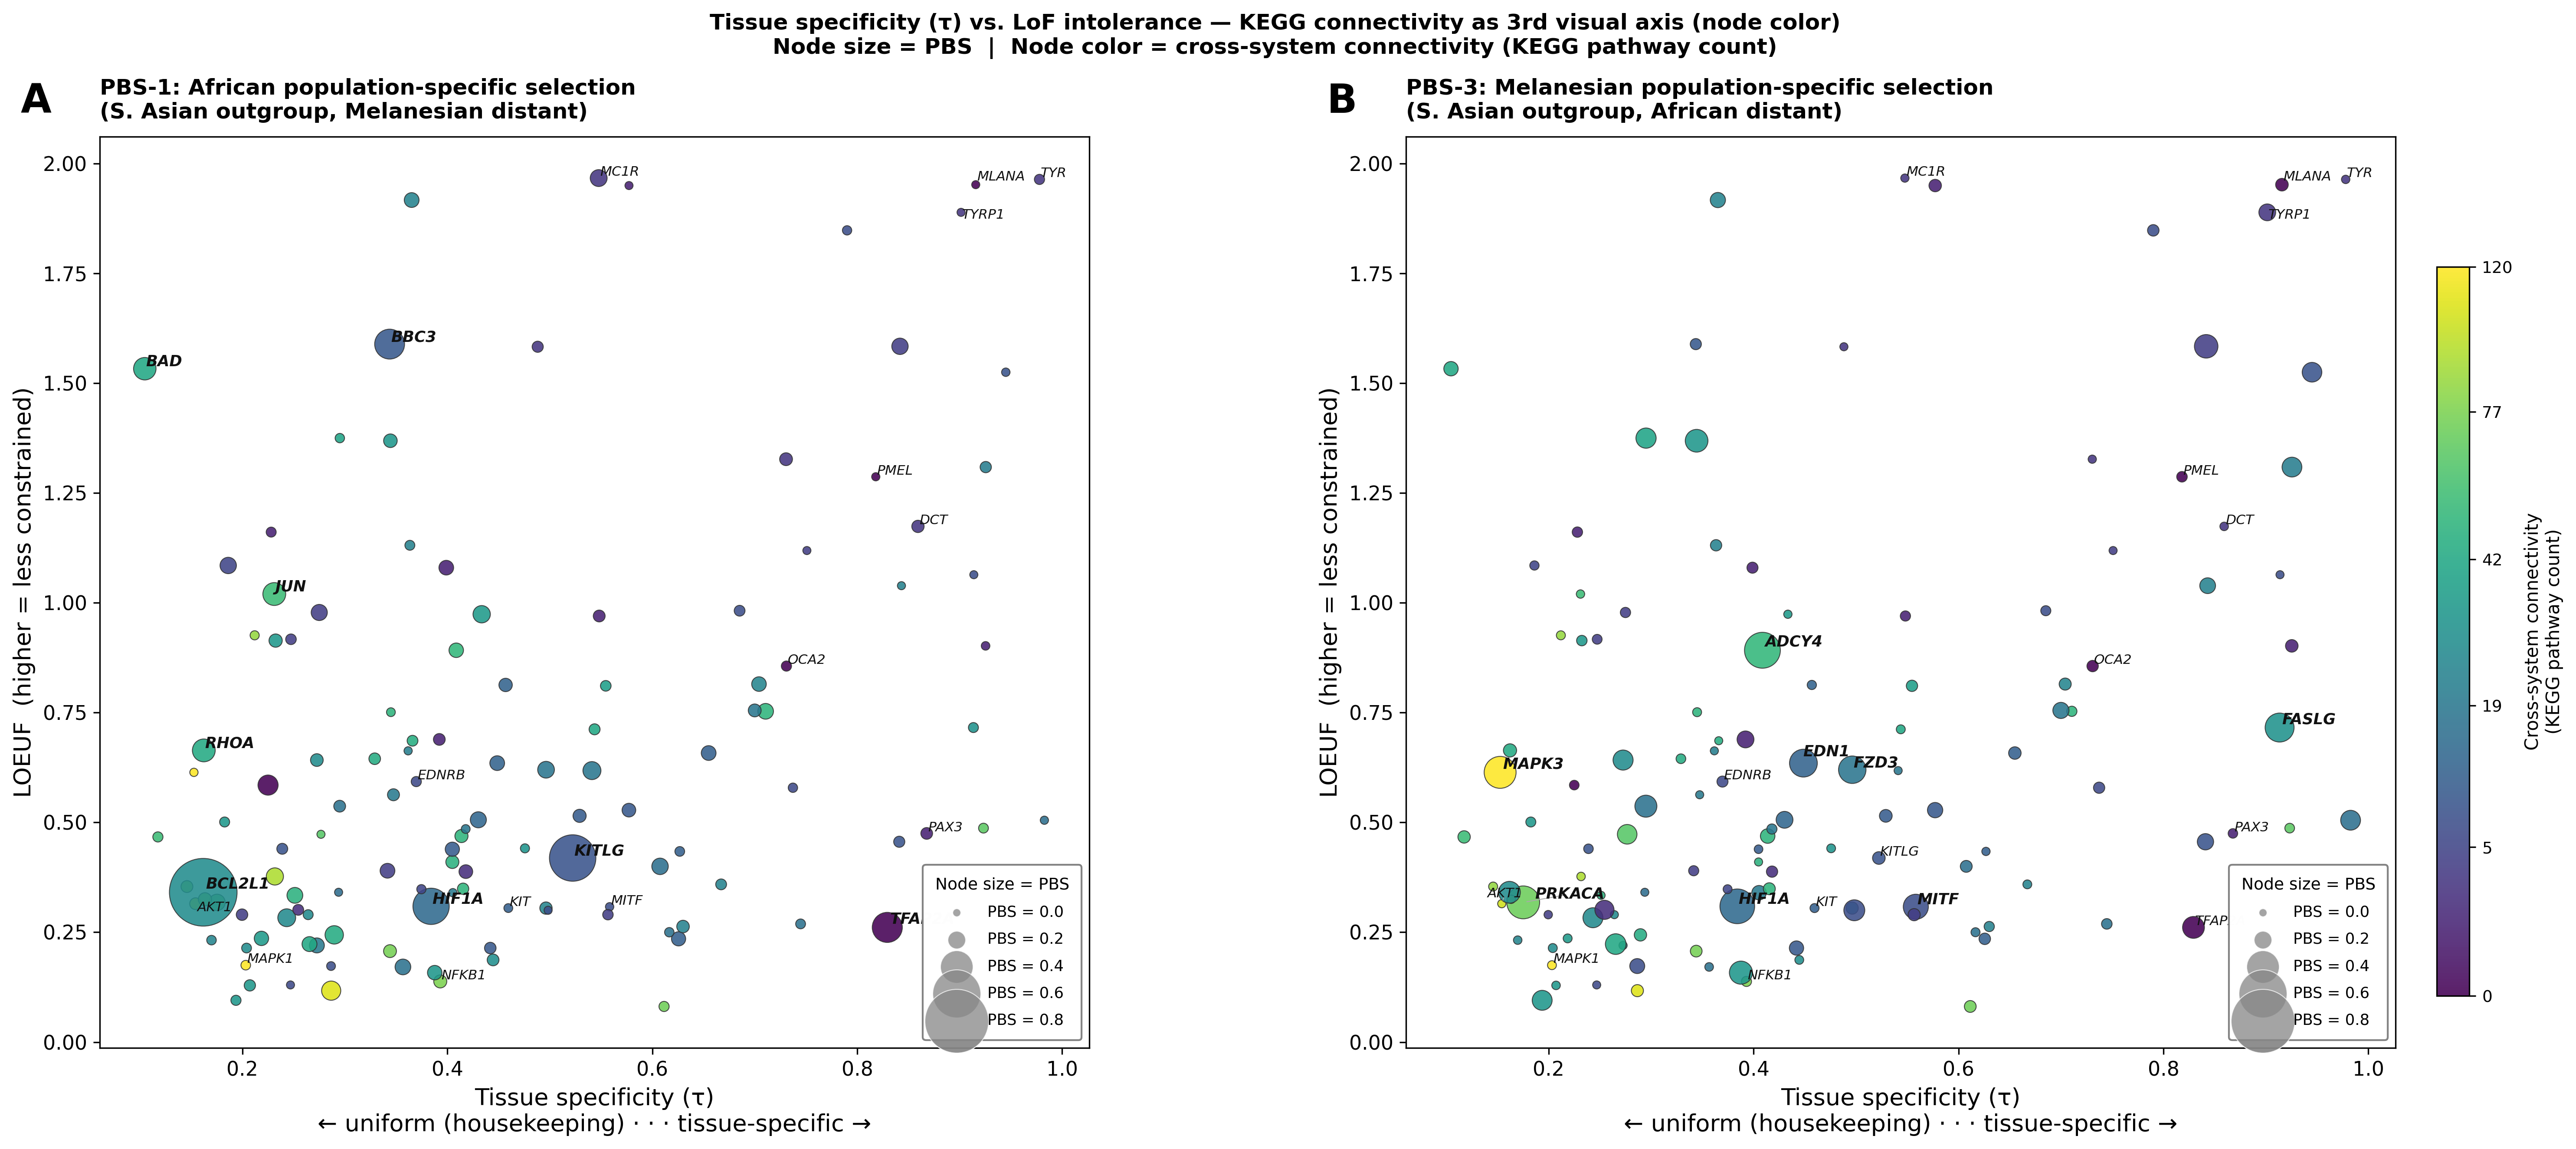
Figure C — KEGG × LOEUF with τ as node color (size = PBS)
Original KEGG × LOEUF axes retained; τ is encoded as continuous node color (blue = housekeeping/τ≈0; red = tissue-specific/τ≈1). Node size = PBS value. Three constraint dimensions visible at once.
The color gradient reveals that broadly expressed genes (blue) cluster toward lower LOEUF (more constrained) and span all connectivity levels, while tissue-specific genes (red) tend toward higher LOEUF, irrespective of KEGG pathway count. The tissue-specificity axis (τ × LOEUF) is independent of the cross-system connectivity axis (KEGG × LOEUF).
Figure D — τ × LOEUF with KEGG connectivity as node color (size = PBS)
Tissue specificity (x) × LoF intolerance (y) with KEGG pathway count encoded as a continuous color gradient (viridis: dark = low connectivity, yellow = high). Node size = PBS value. The same three constraint dimensions as Figure C, with τ and KEGG swapped between axis and color.
This view emphasizes the τ × LOEUF surface and uses KEGG color to show that the high-connectivity hubs (yellow — MAPK3, AKT1, MAPK1) cluster at low τ (housekeeping) and low LOEUF (constrained), while the high-τ, high-LOEUF region (top-right) is occupied almost entirely by low-KEGG genes (dark) — the tissue-specific pigment effectors. KEGG connectivity and τ are inversely related, which is why the color and x-axis tend to anti-correlate.
Figure E — τ × LOEUF with π (nucleotide diversity) as node color
Same axes as Figure D, but the color gradient now encodes π in the matched population (Panel A: π_african; Panel B: π_melanesian). Plasma colormap. Color scale shared between panels and clipped at the 5th–95th percentile to keep high-diversity outliers (MC1R) from compressing the dynamic range.
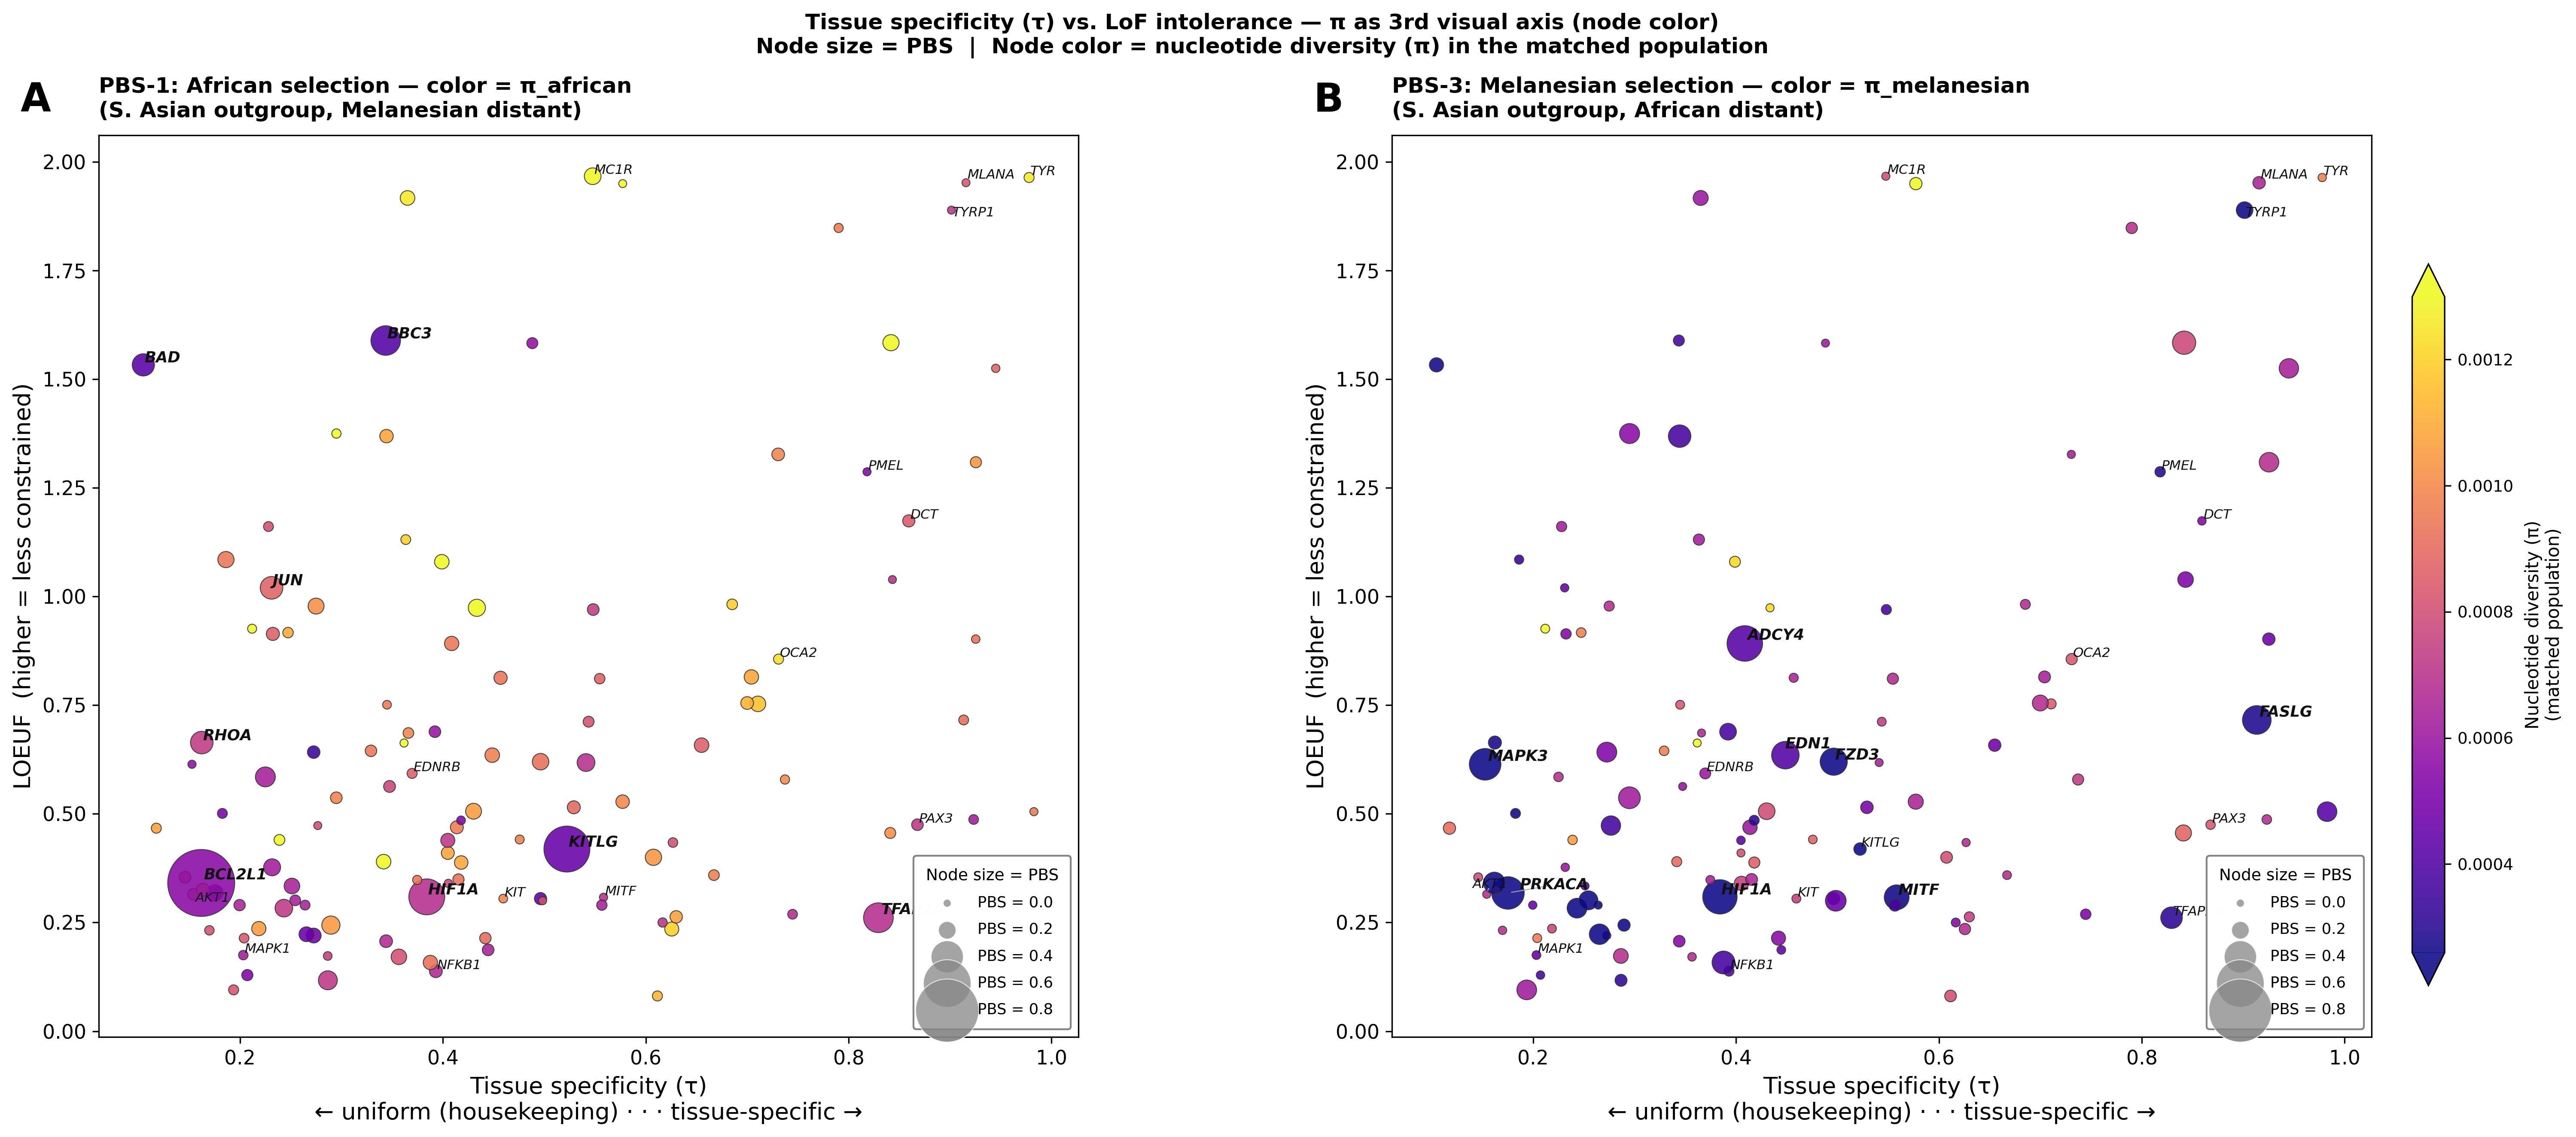
The π color reveals which selected genes also carry elevated within-population diversity. MC1R (top-right of both panels) is the most diverse pigment-specific gene in both populations. Most BCL2L1 / KITLG / TFAP2A African signals (Panel A) sit at low π — selection has reduced diversity. Melanesian signals (Panel B, ADCY4, FZD3, MAPK3) span a wider π range — diverse selection histories.
Phase 2.7 — African vs. Melanesian selection contrast
Three figures isolating the population-specific signal while preserving LOEUF / τ / KEGG context. Source: analysis/phase2_pop_difference.py.
Figure F — ΔPBS (Melanesian − African) vs. each constraint axis
Three panels. Y-axis = PBS-3 − PBS-1 in all. Above zero = Melanesian-dominant selection; below zero = African-dominant. X-axis cycles through LOEUF, τ, and KEGG pathway count. Spearman ρ in each panel.
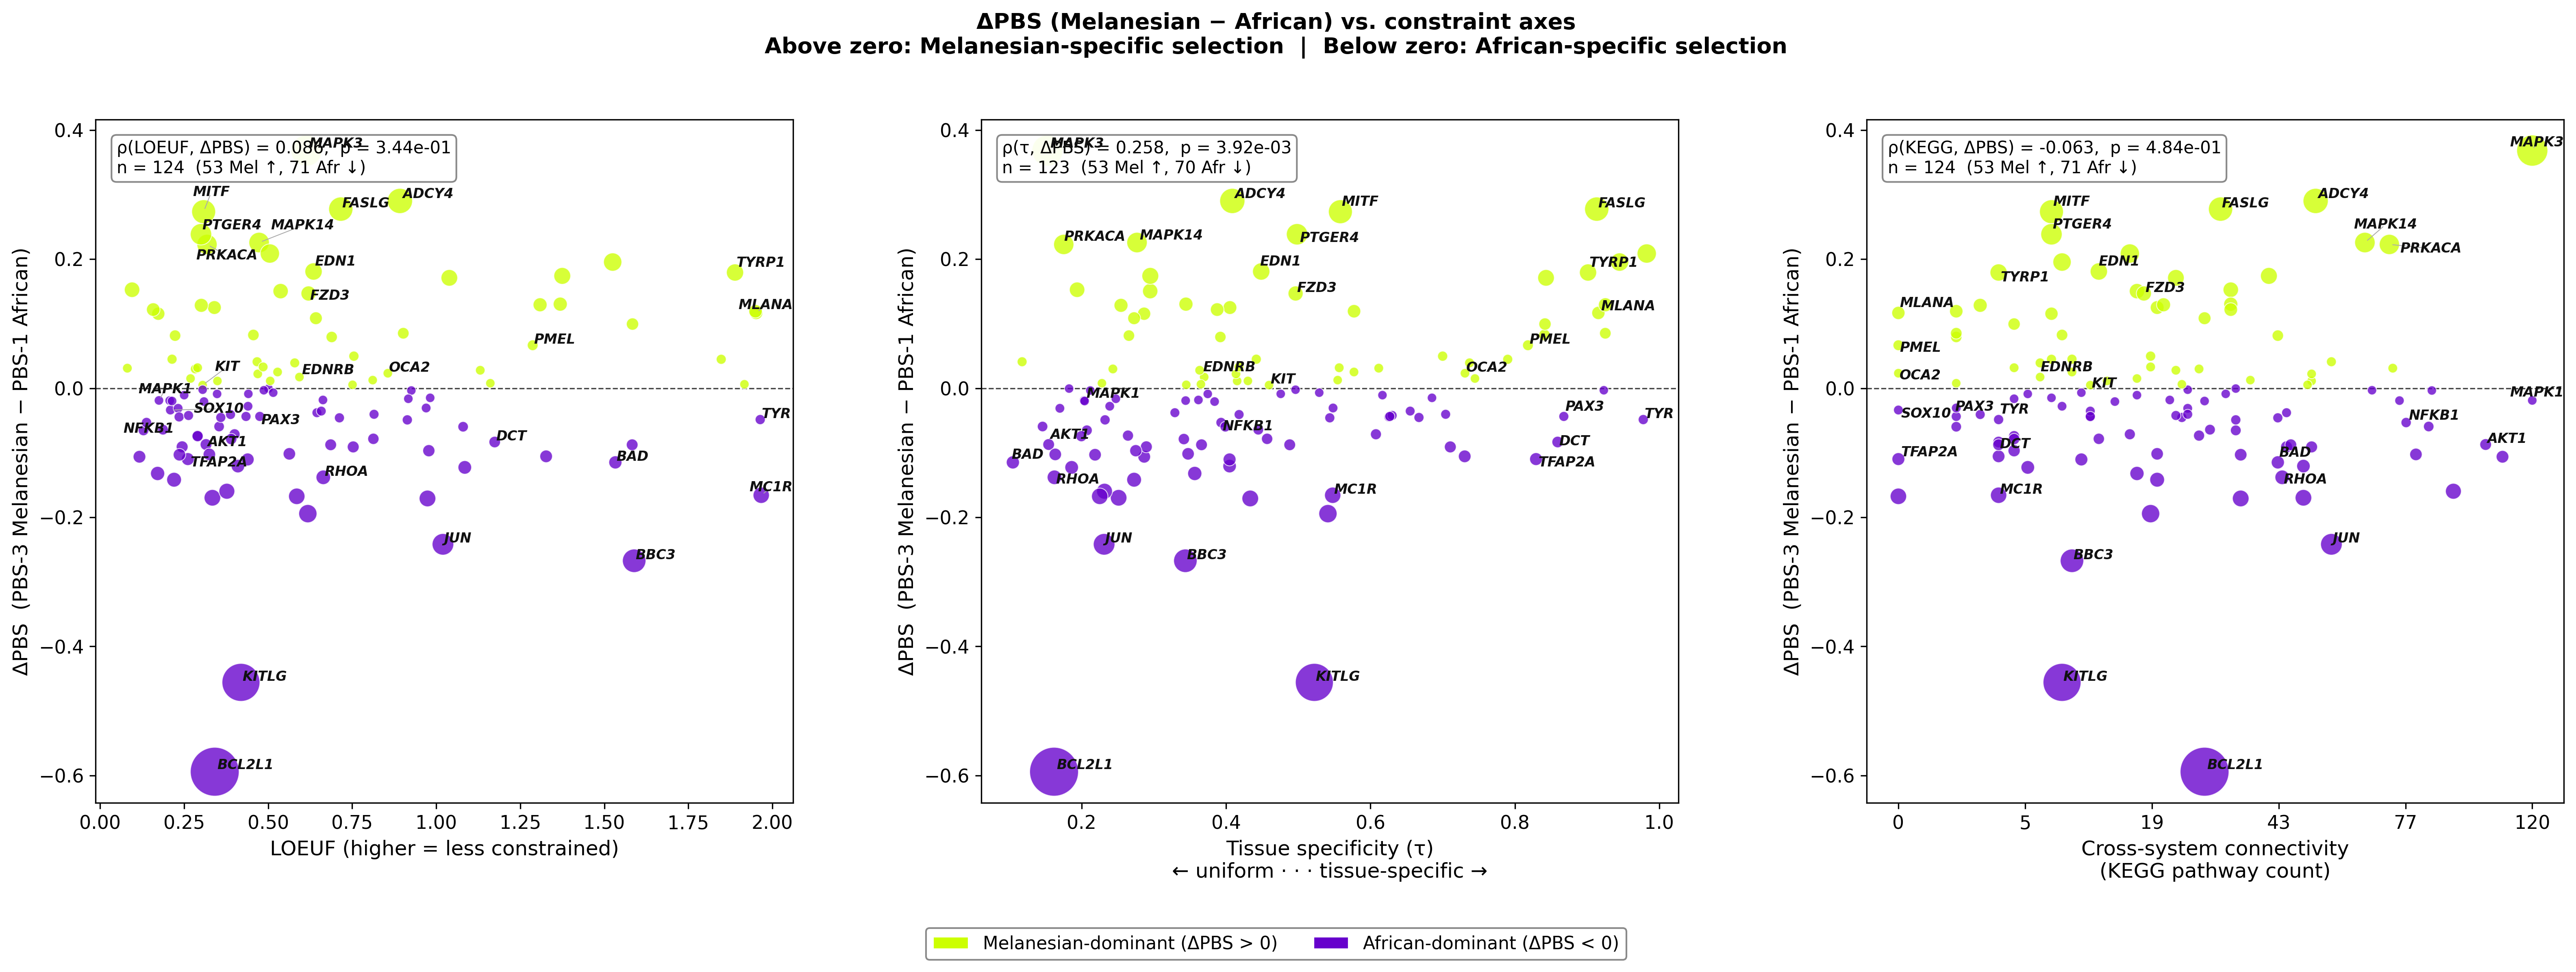
The middle panel (ΔPBS vs. τ) shows the strongest signal: ρ(τ, ΔPBS) = 0.258, p = 3.9×10⁻³ — Melanesian-dominant genes are significantly more tissue-specific than African-dominant genes. LOEUF and KEGG show no significant gradient. African selection is concentrated on low-τ (broadly expressed) genes like BCL2L1, KITLG, TFAP2A.
Figure G — PBS-1 × PBS-3 scatter, three colorings (LOEUF / τ / KEGG)
Direct visualization of the African × Melanesian selection plane. Diagonal y=x marks equal selection; off-diagonal points are population-specific. Three independent panels recolor the same scatter by LOEUF, τ, and KEGG so the constraint structure within the off-diagonal genes is visible.
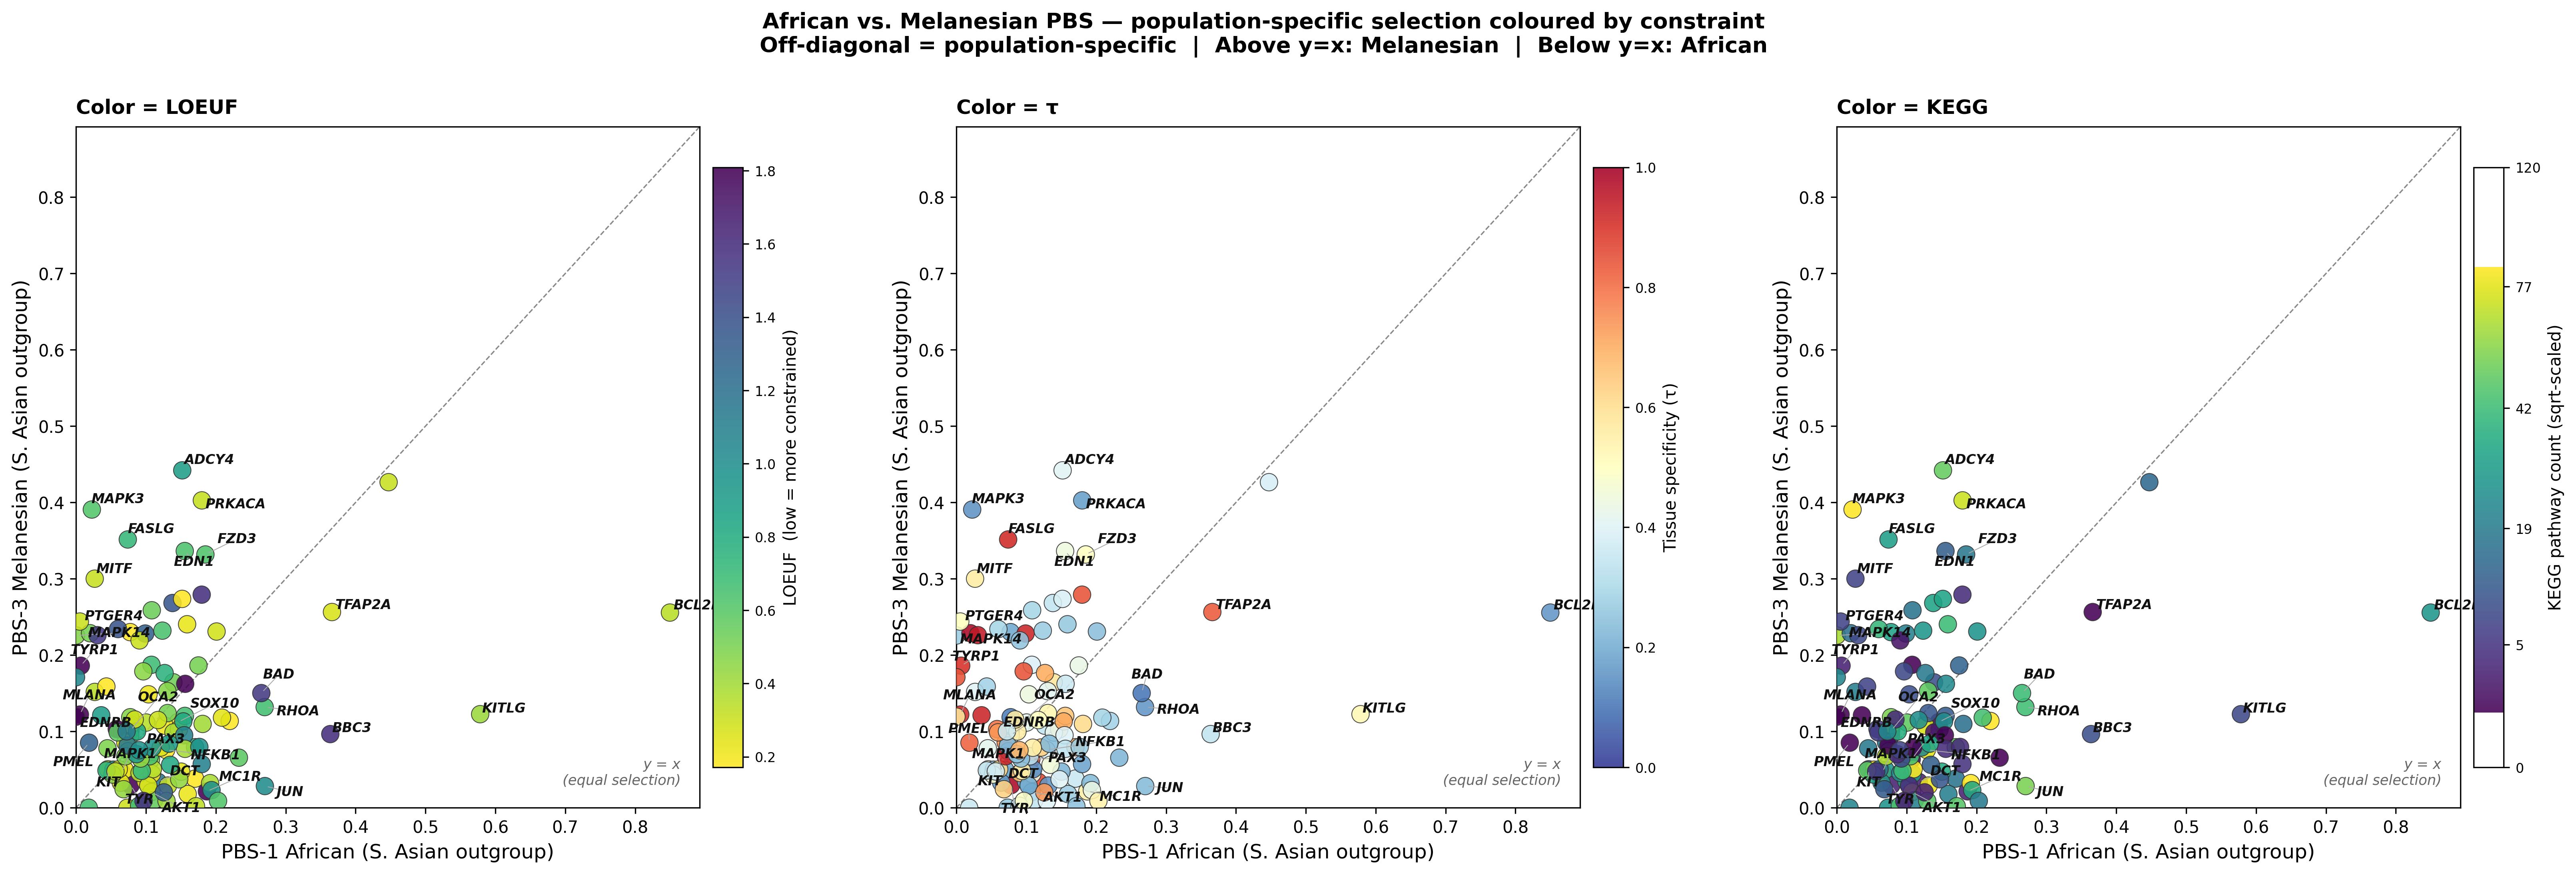
The τ panel (middle) shows a clear gradient — the upper-left cluster (Melanesian-dominant: ADCY4, FZD3, PRKACA, MAPK3, MITF, FASLG) skews yellow-orange (intermediate-to-high τ), whereas the lower-right cluster (African-dominant: BCL2L1, KITLG, BBC3, TFAP2A) skews blue (low τ / broadly expressed).
Figure H — Quadrant analysis with constraint distributions
Top: PBS-1 × PBS-3 scatter partitioned at the 75th-percentile threshold of each axis into four quadrants (African-specific, Melanesian-specific, Both, Neither). Bottom row: violin plots of LOEUF, τ, and KEGG pathway count within each quadrant, with Mann-Whitney p-values comparing African-specific vs. Melanesian-specific quadrants.
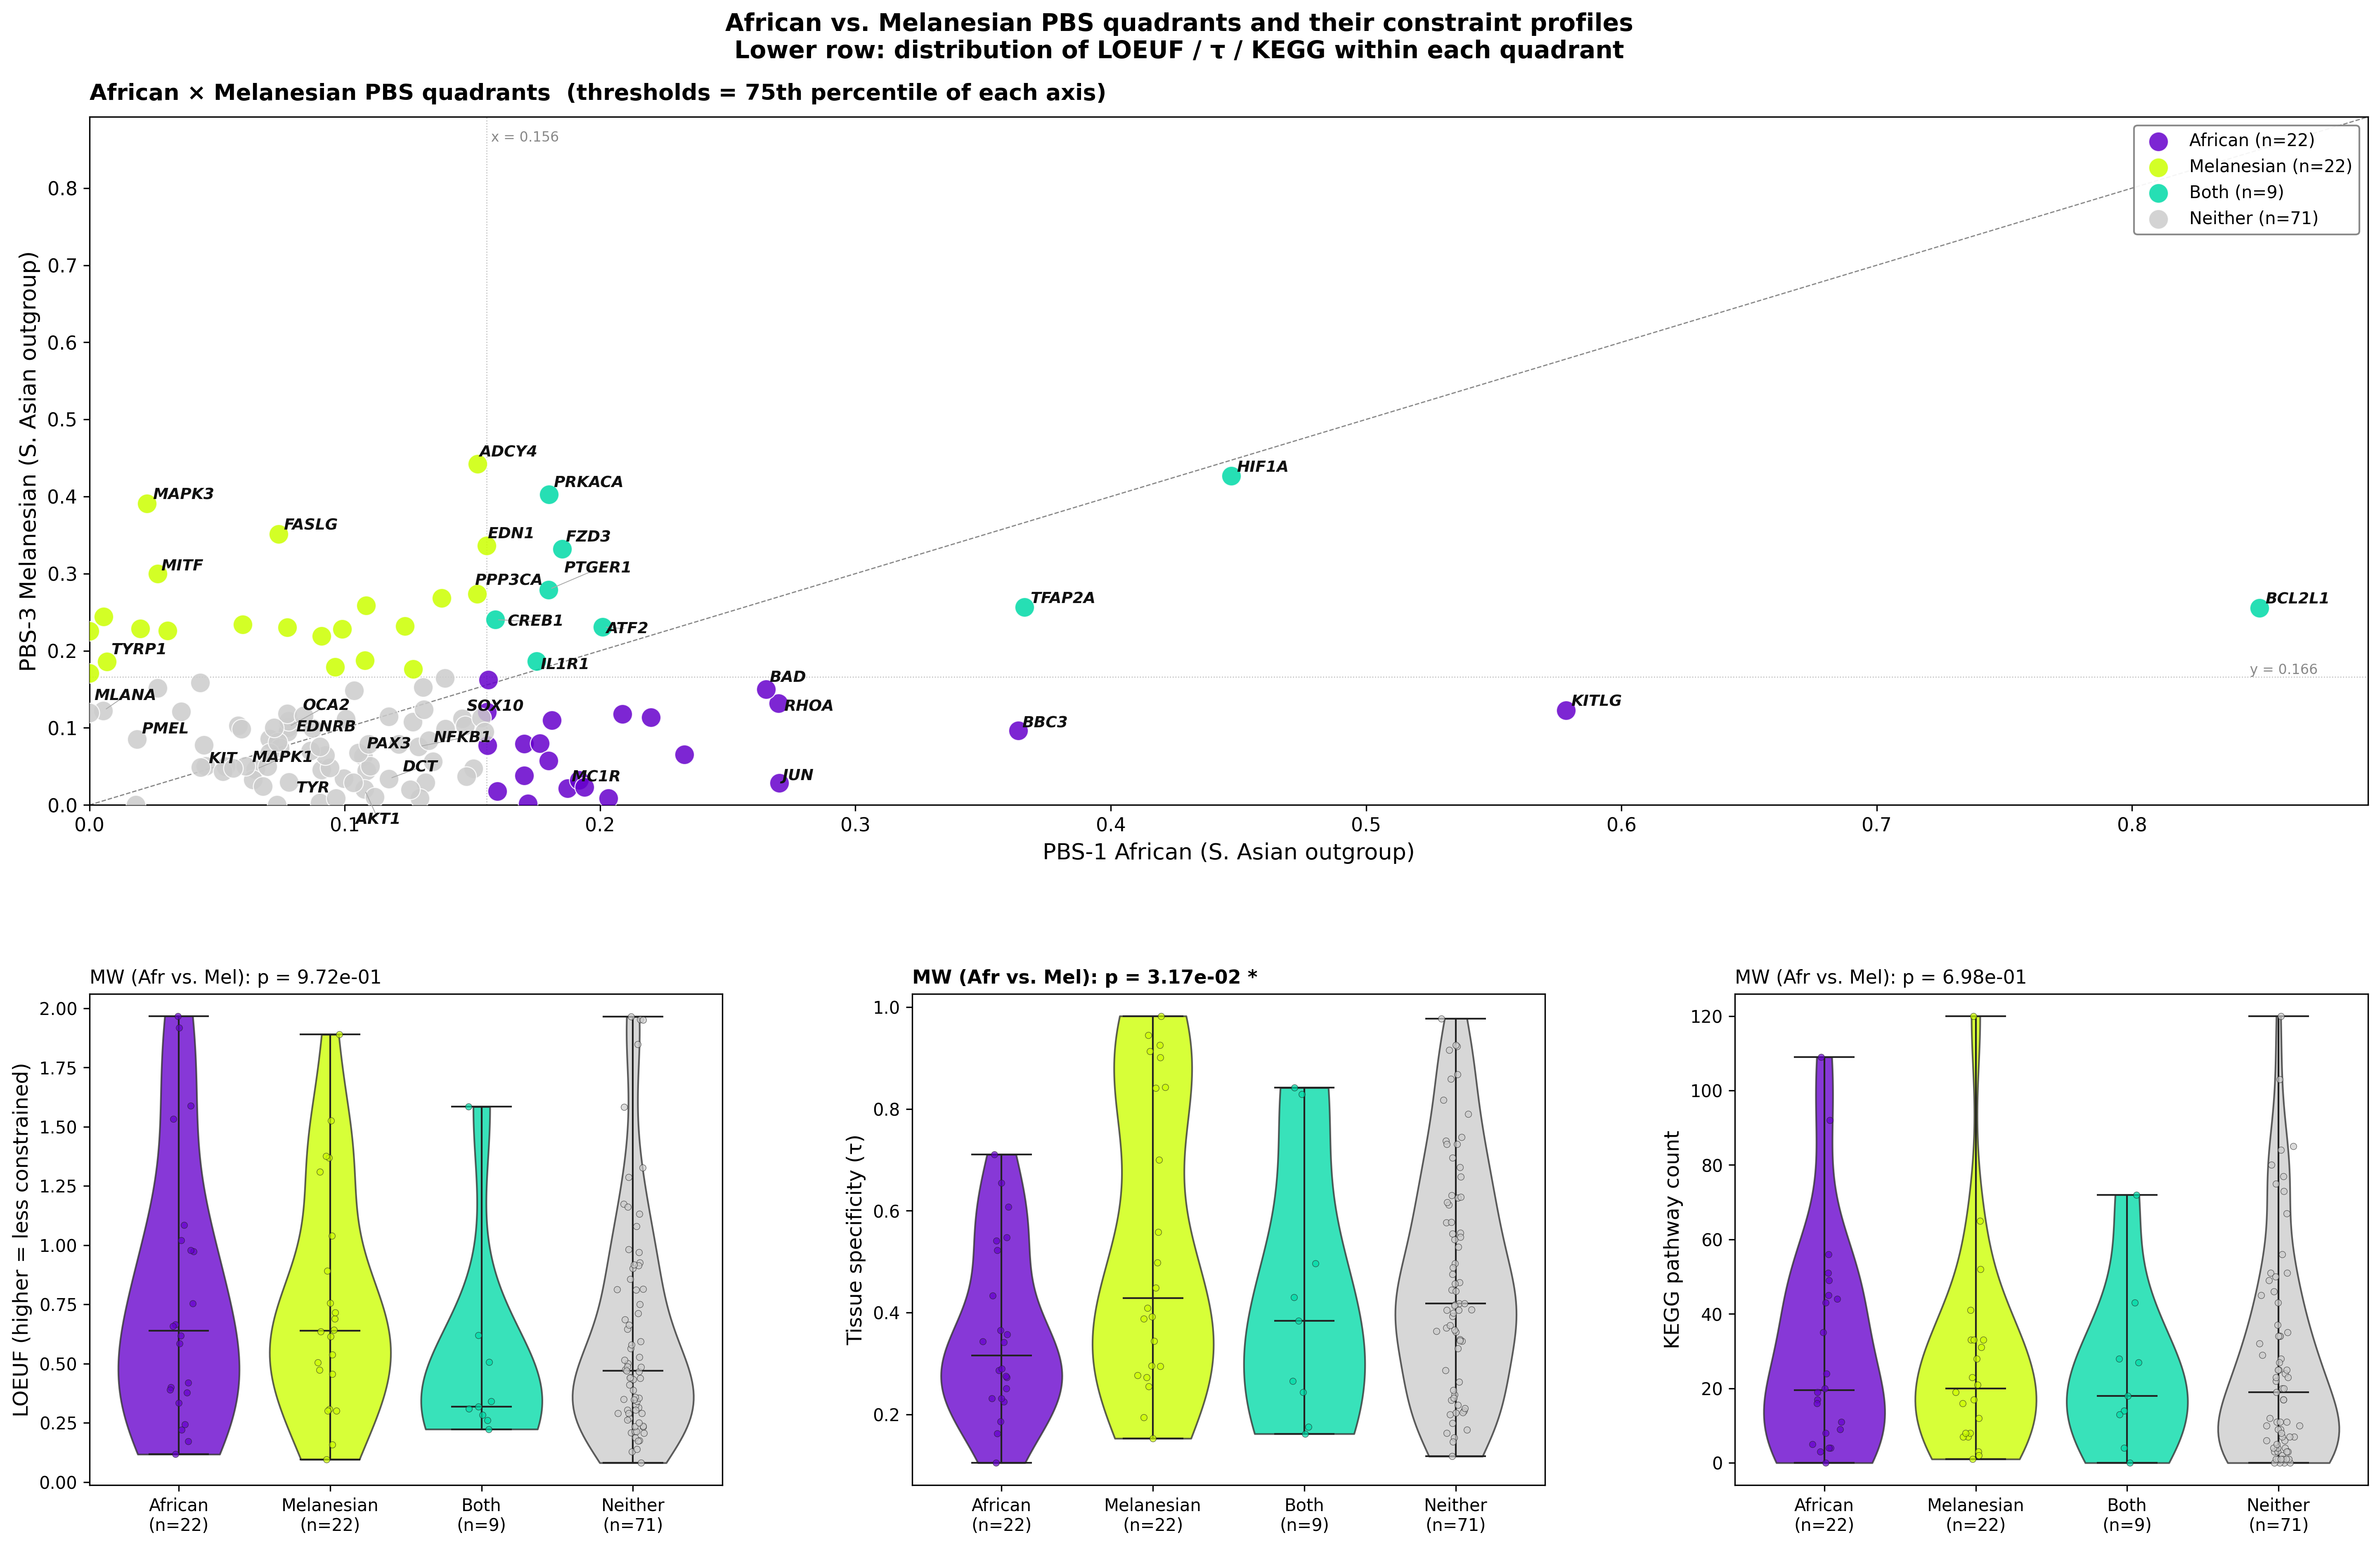
Quadrant counts: 22 African-specific, 22 Melanesian-specific, 9 Both, 71 Neither.
Mann-Whitney (Afr-specific vs. Mel-specific):
| Constraint | p | Interpretation |
|---|---|---|
| LOEUF | 0.97 | No constraint difference between population-specific quadrants |
| τ | 0.032 * | Mel-specific genes are more tissue-specific than Afr-specific |
| KEGG | 0.70 | No connectivity difference |
This is the headline statistical result for the population contrast: the two populations are selecting genes from different positions on the tissue-specificity axis, but they show no difference in LoF intolerance or cross-system connectivity. African selection prefers broadly expressed network genes; Melanesian selection prefers more tissue-specific ones.
Data provenance
| File | Description | Generated by |
|---|---|---|
vcf/final/african.vcf.gz |
747 African samples, 184,859 variants | Cluster pipeline 01–06 |
vcf/final/melanesian.vcf.gz |
47 Melanesian samples (30 HGDP + 17 SGDP) | Cluster pipeline 01–06 |
vcf/final/southasian.vcf.gz |
790 South Asian samples, 167,302 variants | Cluster pipeline 01–06 |
vcf/final/eastasian.vcf.gz |
718 East Asian samples, 137,663 variants | Cluster pipeline 01–06 |
vcf/final/european.vcf.gz |
788 European samples, 135,432 variants | Cluster pipeline 01–06 |
output/pi_per_gene.csv |
Per-gene π for all 5 populations | analysis/cluster/07_compute_pi.py |
output/pbs_per_gene.csv |
Per-gene PBS (4 scans) + pairwise FST | analysis/cluster/08_compute_pbs.py |
output/figure_phase2_network_selection.png |
Network position × PBS figure | analysis/phase2_network_selection.py |
gnomAD HGDP+1KGP v3.1.2 joint callset; SGDP Simons.vcf.gz (hg19→hg38 via bcftools +liftover). PBS reference: Bhatia G et al. (2013) Genome Research 23(9):1514–1521.