Phase 1 — Conservation & Expression Breadth
PhyloP evolutionary conservation and GTEx tissue expression
Overview
Phase 1 adds two independent constraint axes to the network analysis:
- Phase 1.1 — PhyloP: Mean vertebrate conservation score (100-way, hg38) per gene, fetched from UCSC. Tests whether functional categories differ in evolutionary conservation.
- Phase 1.2 — GTEx: Tissue expression breadth (number of tissues with median TPM > 1, GTEx v8, 54 tissues). Tests Hypothesis 2: broadly expressed genes show stronger constraint.
Both metrics are merged with the Raghunath 129-gene LOEUF dataset in:
data/network_constraint_phylop.csvdata/network_constraint_gtex.csv
Phase 1.1 — PhyloP evolutionary conservation
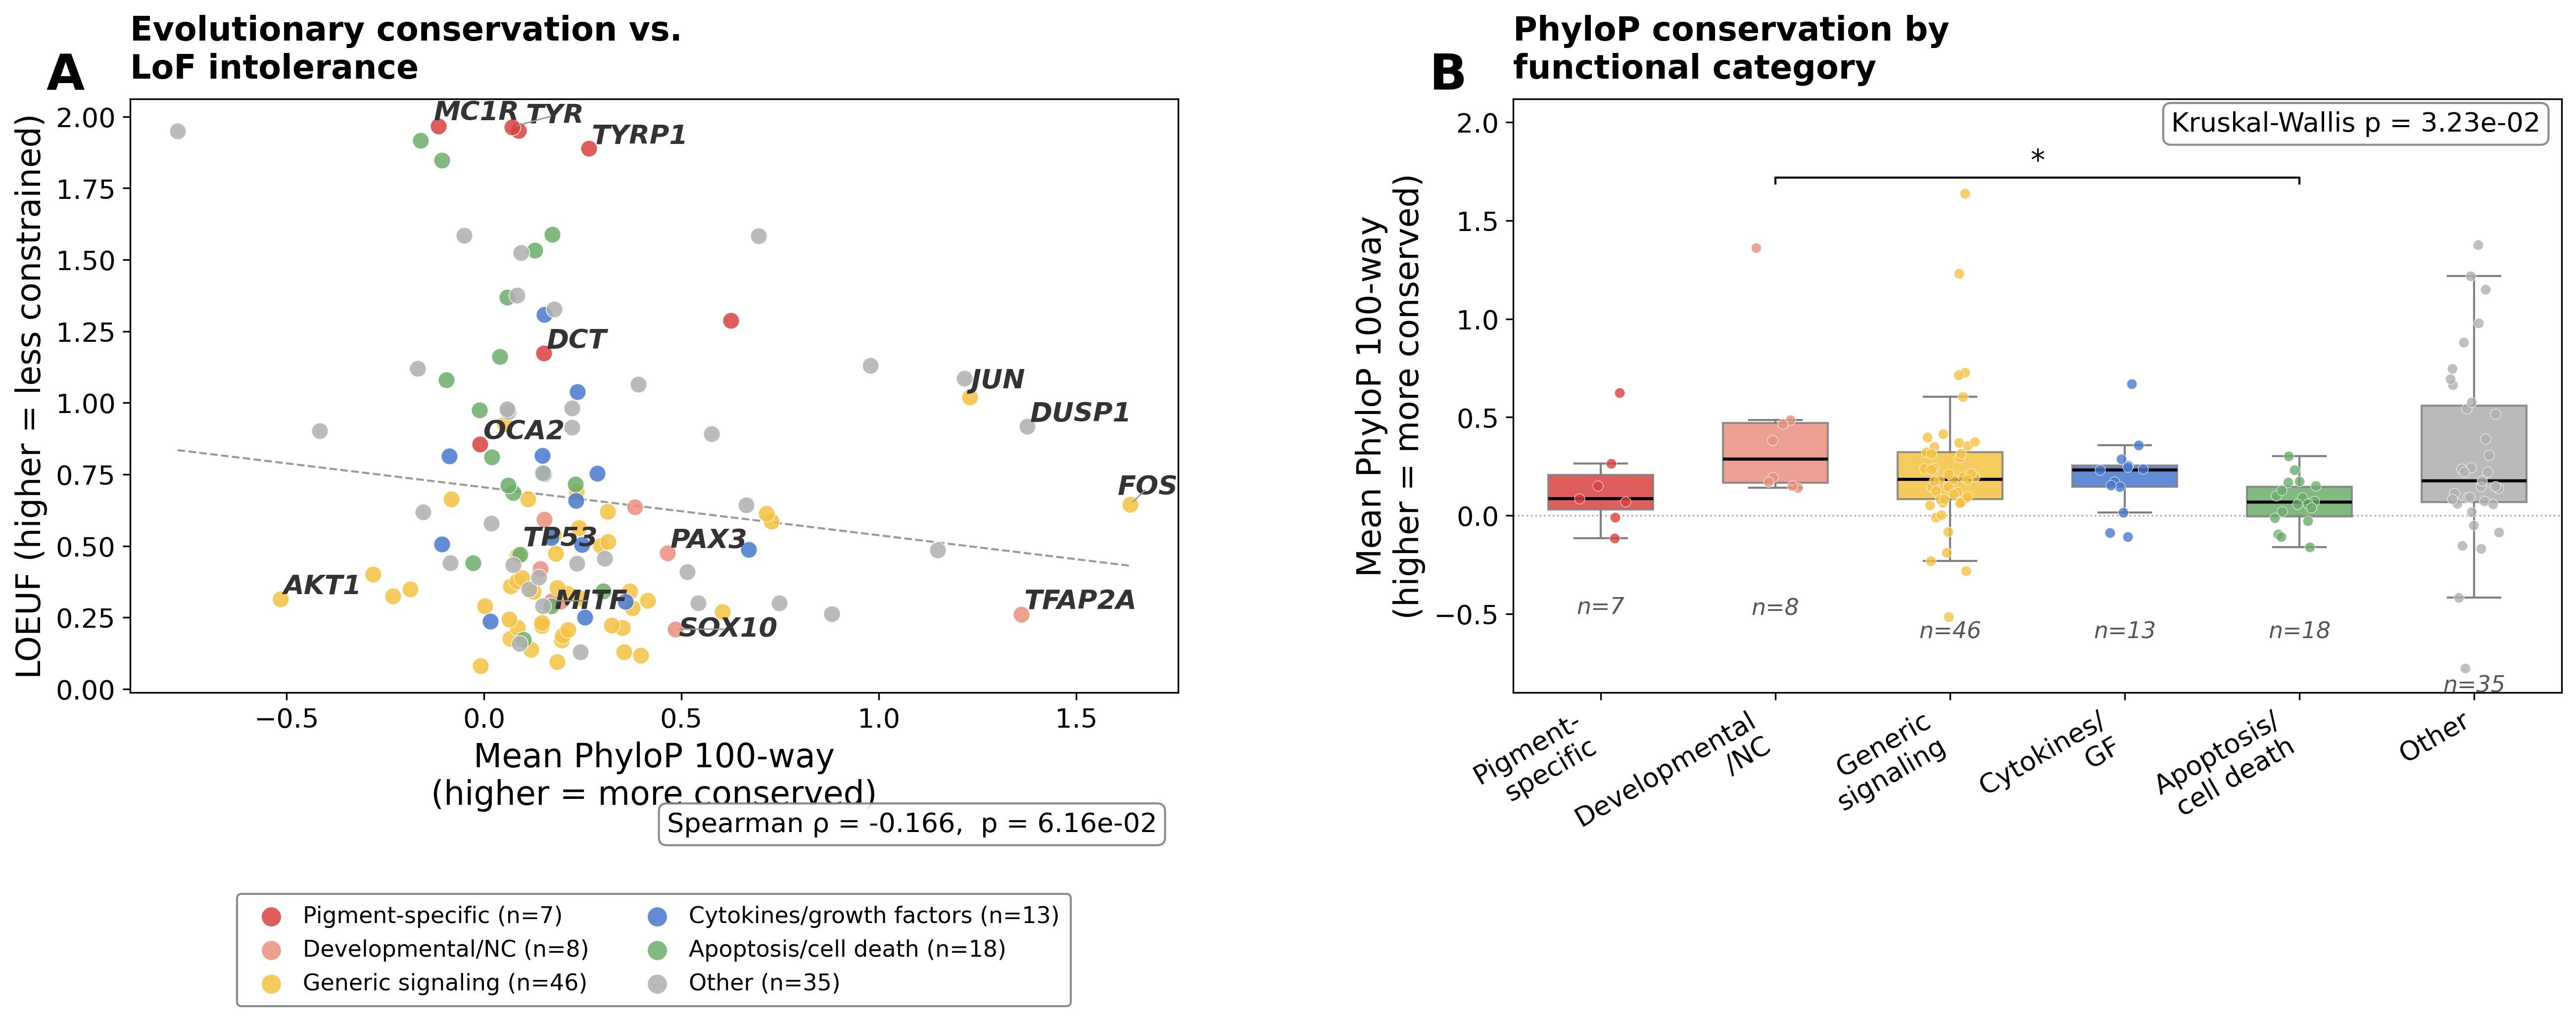
Spearman ρ(PhyloP, LOEUF) = -0.166, p = 6.164e-02 — genes with higher PhyloP conservation scores tend to be more LoF-intolerant (lower LOEUF), consistent with both metrics capturing evolutionary constraint. The Kruskal-Wallis test across functional categories is significant (p = 3.234e-02), with Developmental/NC genes most conserved and Pigment-specific genes least conserved.
Key genes
| gene | functional_category | LOEUF | Mean PhyloP 100-way | |
|---|---|---|---|---|
| 0 | TFAP2A | Developmental/NC | 0.261 | 1.360723 |
| 1 | SOX10 | Developmental/NC | 0.209 | 0.485107 |
| 2 | PAX3 | Developmental/NC | 0.475 | 0.465089 |
| 3 | TYRP1 | Pigment-specific | 1.889 | 0.265219 |
| 4 | MITF | Developmental/NC | 0.308 | 0.171432 |
| 5 | DCT | Pigment-specific | 1.174 | 0.151017 |
| 6 | TYR | Pigment-specific | 1.964 | 0.071985 |
| 7 | OCA2 | Pigment-specific | 0.856 | -0.009525 |
| 8 | MC1R | Pigment-specific | 1.967 | -0.114877 |
PhyloP summary by functional category
| N | Median PhyloP | Mean PhyloP | |
|---|---|---|---|
| functional_category | |||
| Pigment-specific | 7 | 0.087 | 0.154 |
| Developmental/NC | 8 | 0.288 | 0.419 |
| Generic signaling | 46 | 0.185 | 0.231 |
| Cytokines/growth factors | 13 | 0.233 | 0.199 |
| Apoptosis/cell death | 18 | 0.068 | 0.067 |
| Other | 35 | 0.178 | 0.301 |
Phase 1.2 — GTEx tissue expression breadth
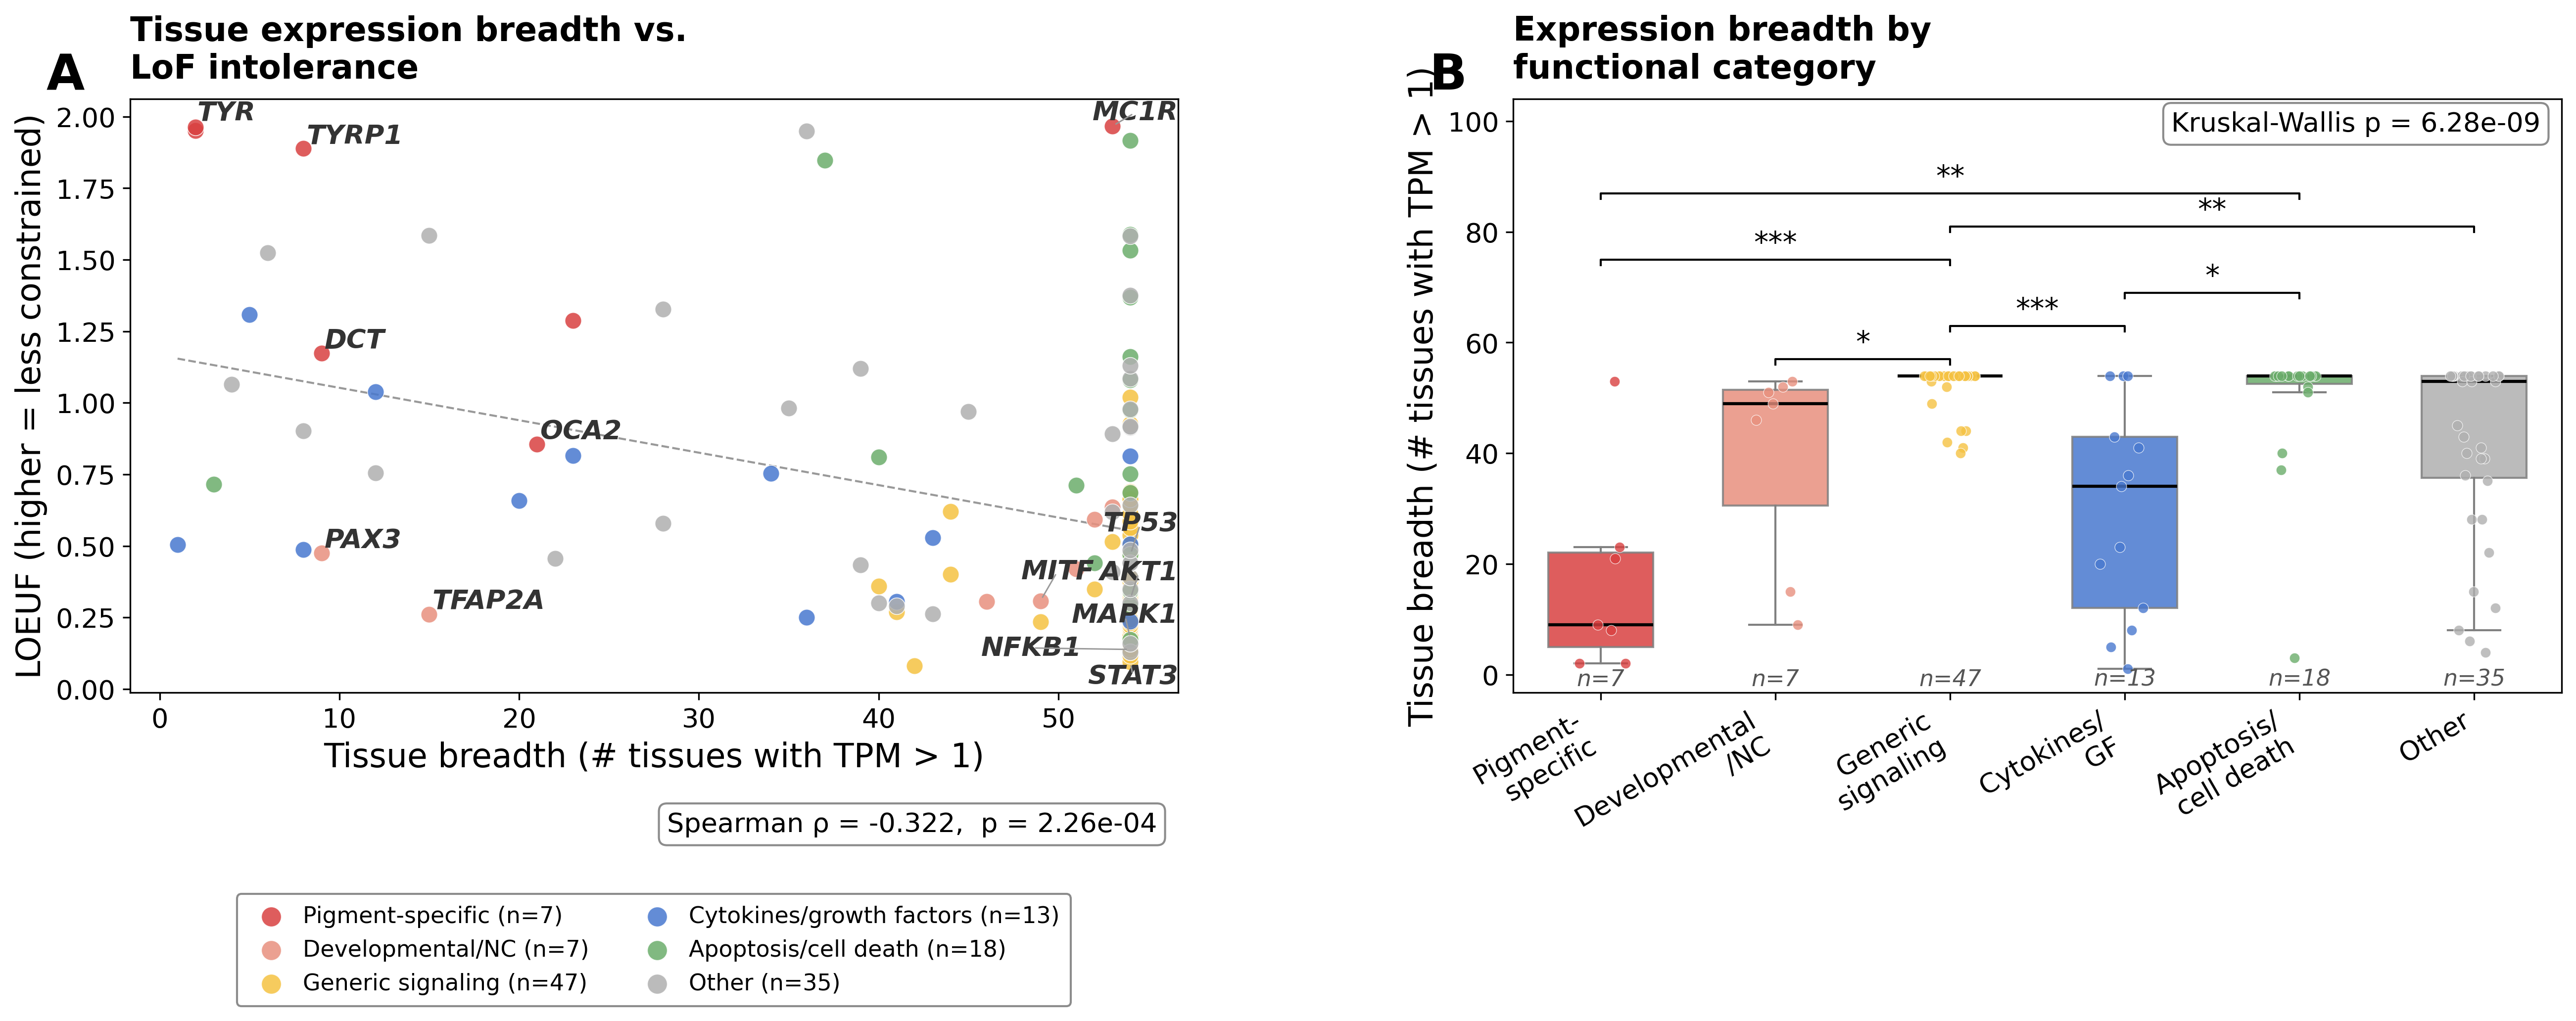
Spearman ρ(tissue breadth, LOEUF) = -0.322, p = 2.261e-04 — the strongest constraint signal in Phase 1. Genes expressed broadly across tissues are far more LoF-intolerant than tissue-specific genes. The Kruskal-Wallis test is highly significant (p = 6.276e-09).
Hypothesis 2 test — Regression: LOEUF ~ tissue breadth + functional category
| coef | std err | t | P>|t| | [0.025 | 0.975] | |
|---|---|---|---|---|---|---|
| Intercept | 1.6758 | 0.145 | 11.524 | 0.000 | 1.388 | 1.964 |
| C(functional_category, Treatment("Pigment-specific"))[T.Apoptosis/cell death] | -0.4717 | 0.183 | -2.575 | 0.011 | -0.834 | -0.109 |
| C(functional_category, Treatment("Pigment-specific"))[T.Cytokines/growth factors] | -0.8837 | 0.175 | -5.038 | 0.000 | -1.231 | -0.536 |
| C(functional_category, Treatment("Pigment-specific"))[T.Developmental/NC] | -1.0342 | 0.205 | -5.054 | 0.000 | -1.439 | -0.629 |
| C(functional_category, Treatment("Pigment-specific"))[T.Generic signaling] | -1.0130 | 0.174 | -5.809 | 0.000 | -1.358 | -0.668 |
| C(functional_category, Treatment("Pigment-specific"))[T.Other] | -0.6559 | 0.165 | -3.977 | 0.000 | -0.982 | -0.329 |
| tissue_breadth | -0.0054 | 0.003 | -2.142 | 0.034 | -0.010 | -0.000 |
After controlling for functional category, tissue breadth remains a significant predictor of LOEUF (see tissue_breadth coefficient above). Pigment-specific genes are used as the reference category.
Tissue breadth summary by functional category
| N | Median breadth | Mean breadth | |
|---|---|---|---|
| functional_category | |||
| Pigment-specific | 7 | 9.0 | 16.9 |
| Developmental/NC | 7 | 49.0 | 39.3 |
| Generic signaling | 47 | 54.0 | 52.6 |
| Cytokines/growth factors | 13 | 34.0 | 29.6 |
| Apoptosis/cell death | 18 | 54.0 | 49.2 |
| Other | 35 | 53.0 | 41.8 |
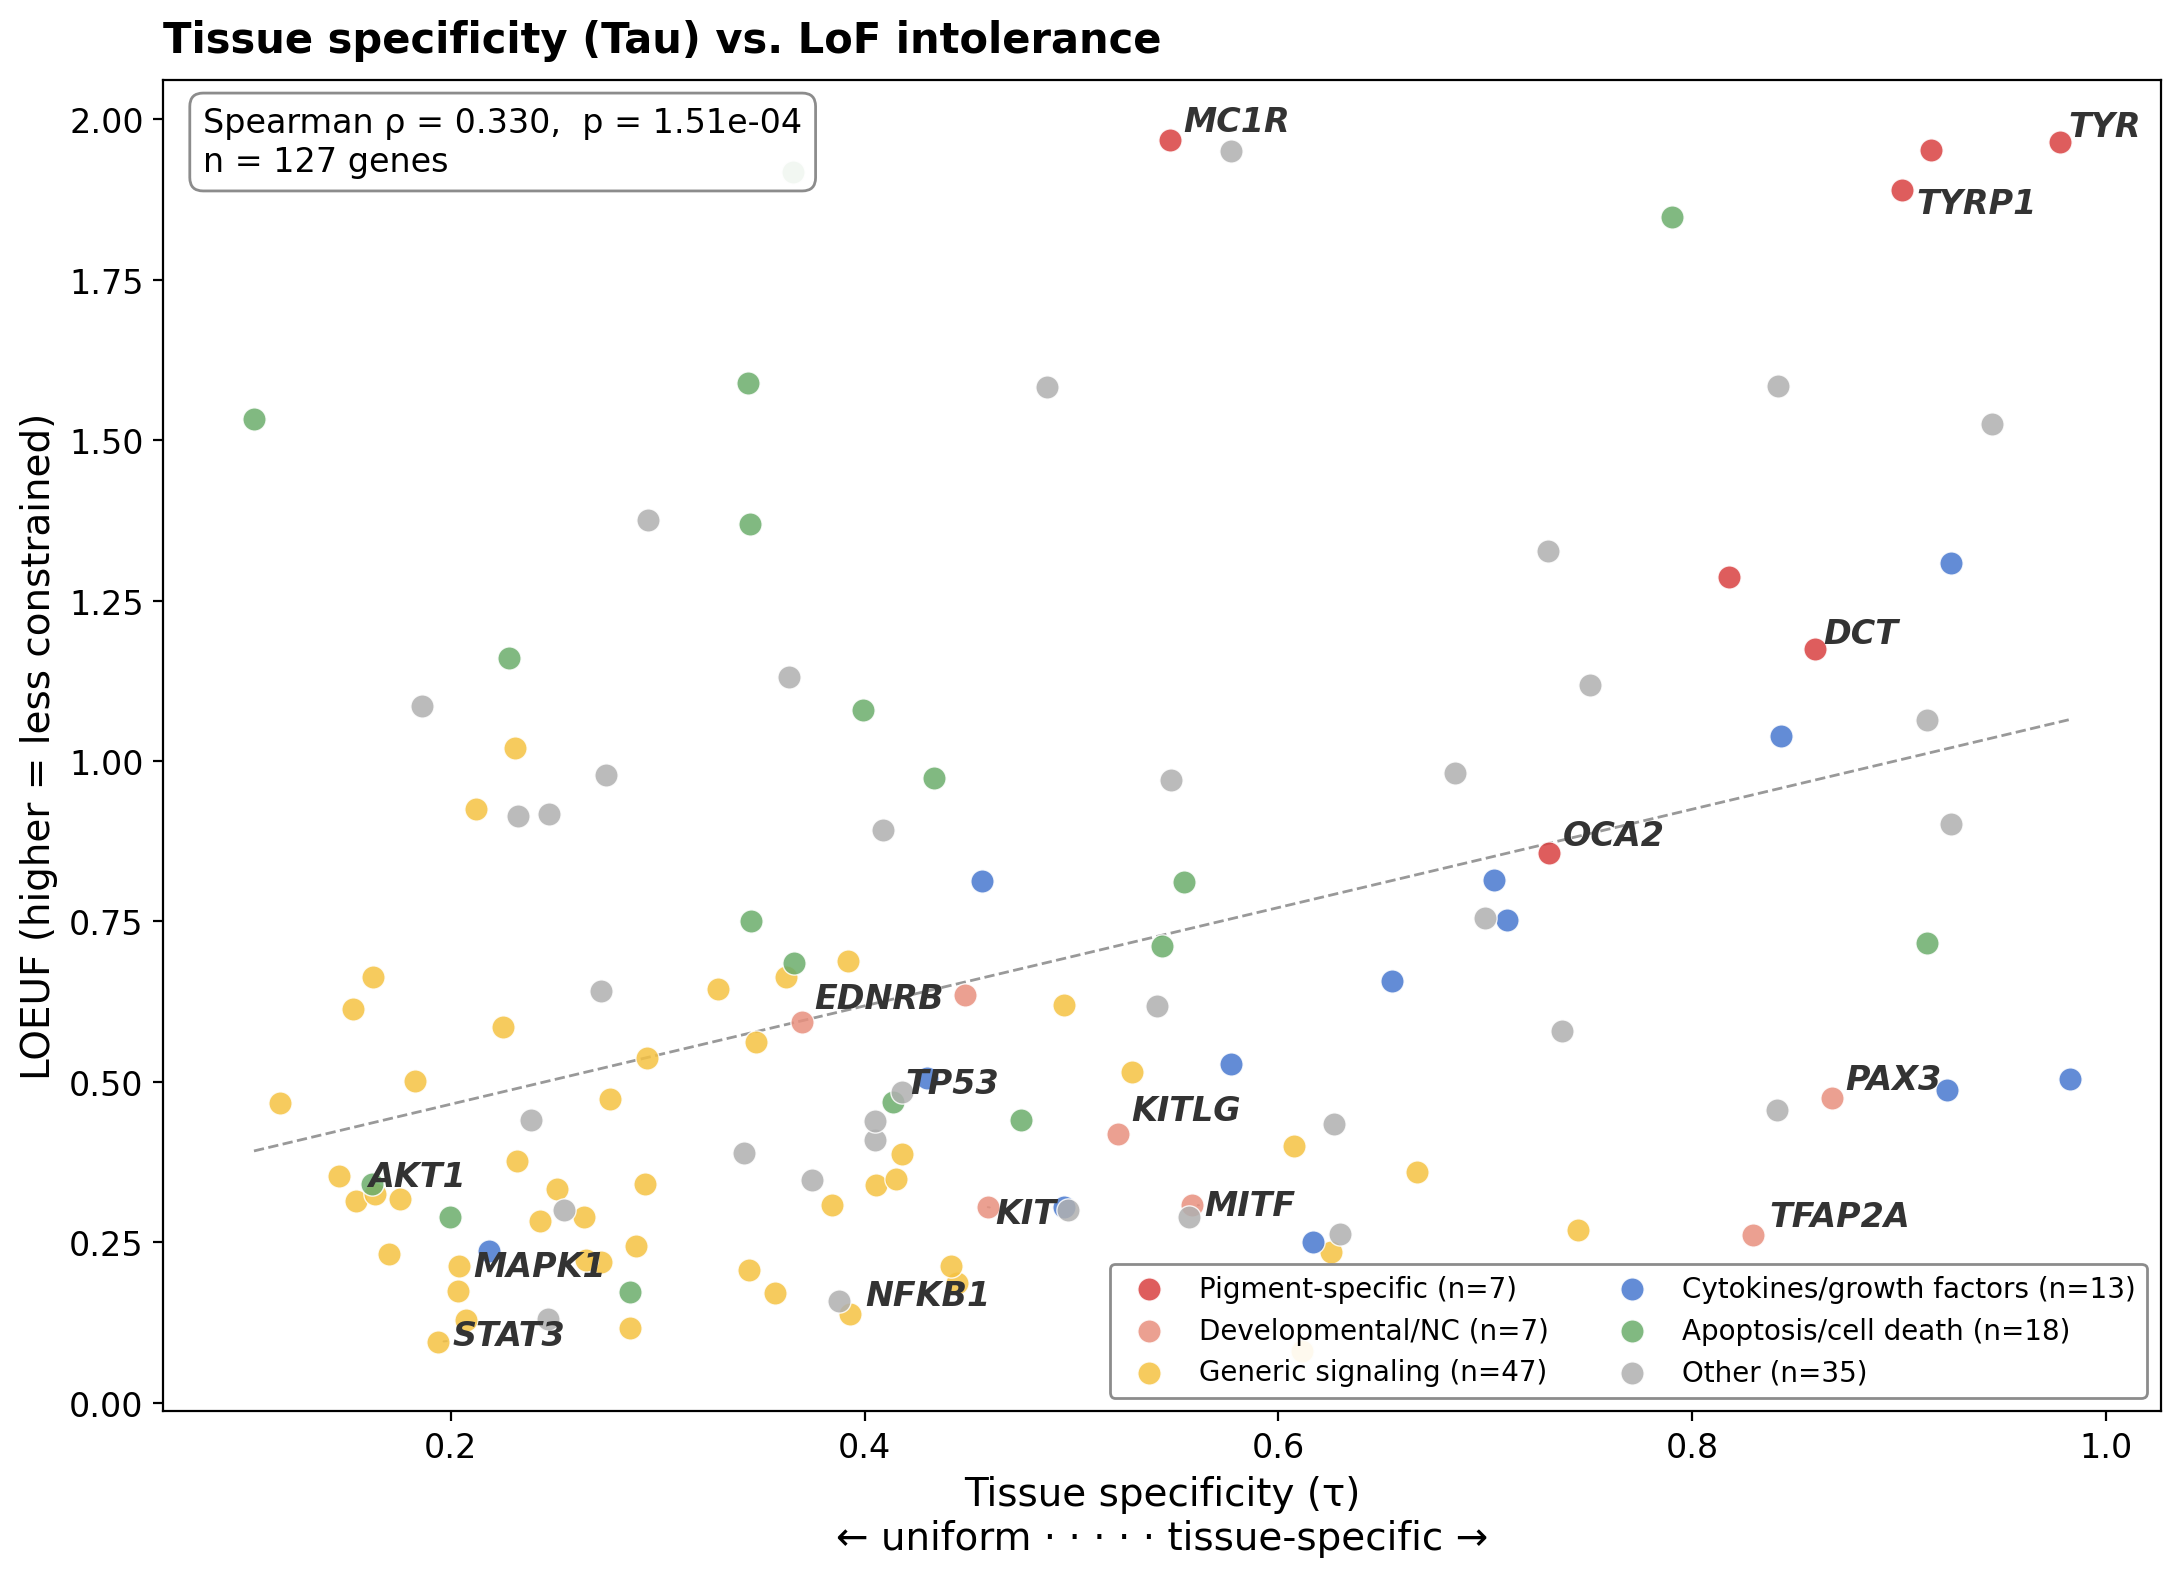
Phase 1.2 supplementary — Tissue specificity (Tau) vs. LOEUF
Tau (τ) is a continuous tissue-specificity index from log2(TPM+1) expression: τ = 0 means uniform expression across all 54 tissues, τ = 1 means expressed in only one tissue. Stronger signal than the binary tissue-breadth count.
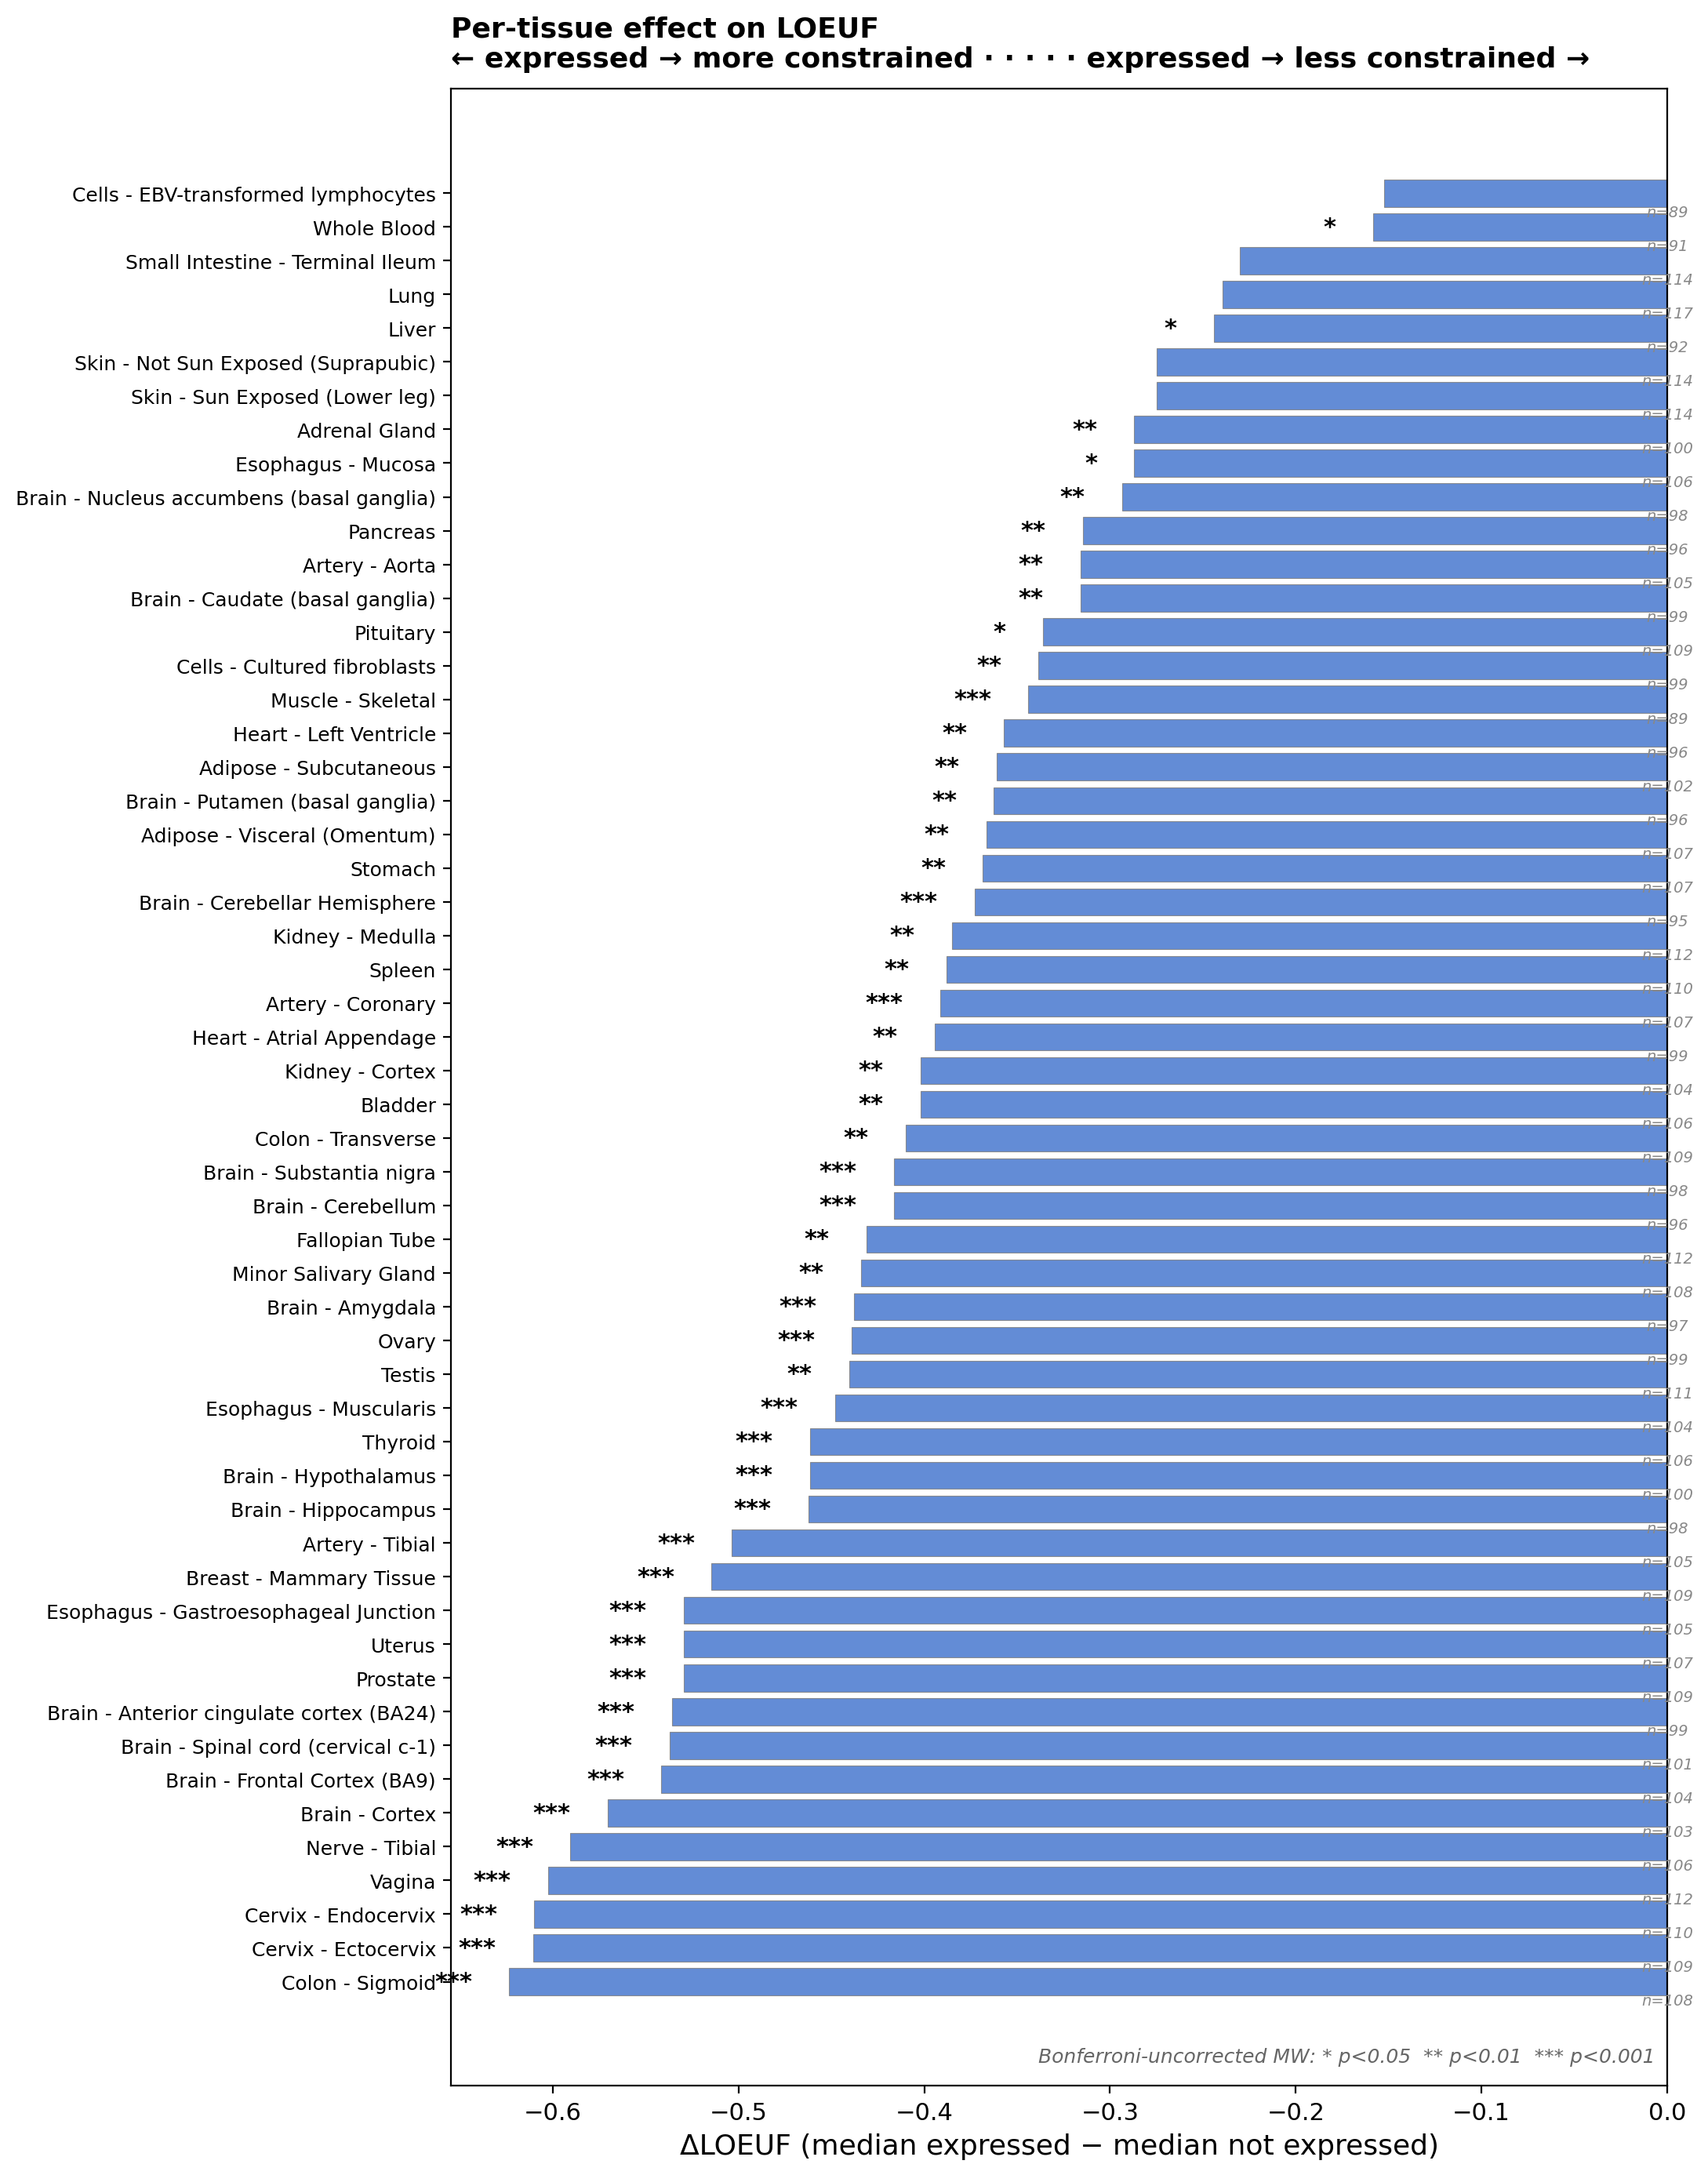
Phase 1.2 supplementary — Per-tissue effect on LOEUF
For each of the 54 GTEx tissues, the difference in median LOEUF between genes expressed there (TPM > 1) vs. not expressed (Mann-Whitney). Negative ΔLOEUF means genes expressed in that tissue are more LoF-constrained.
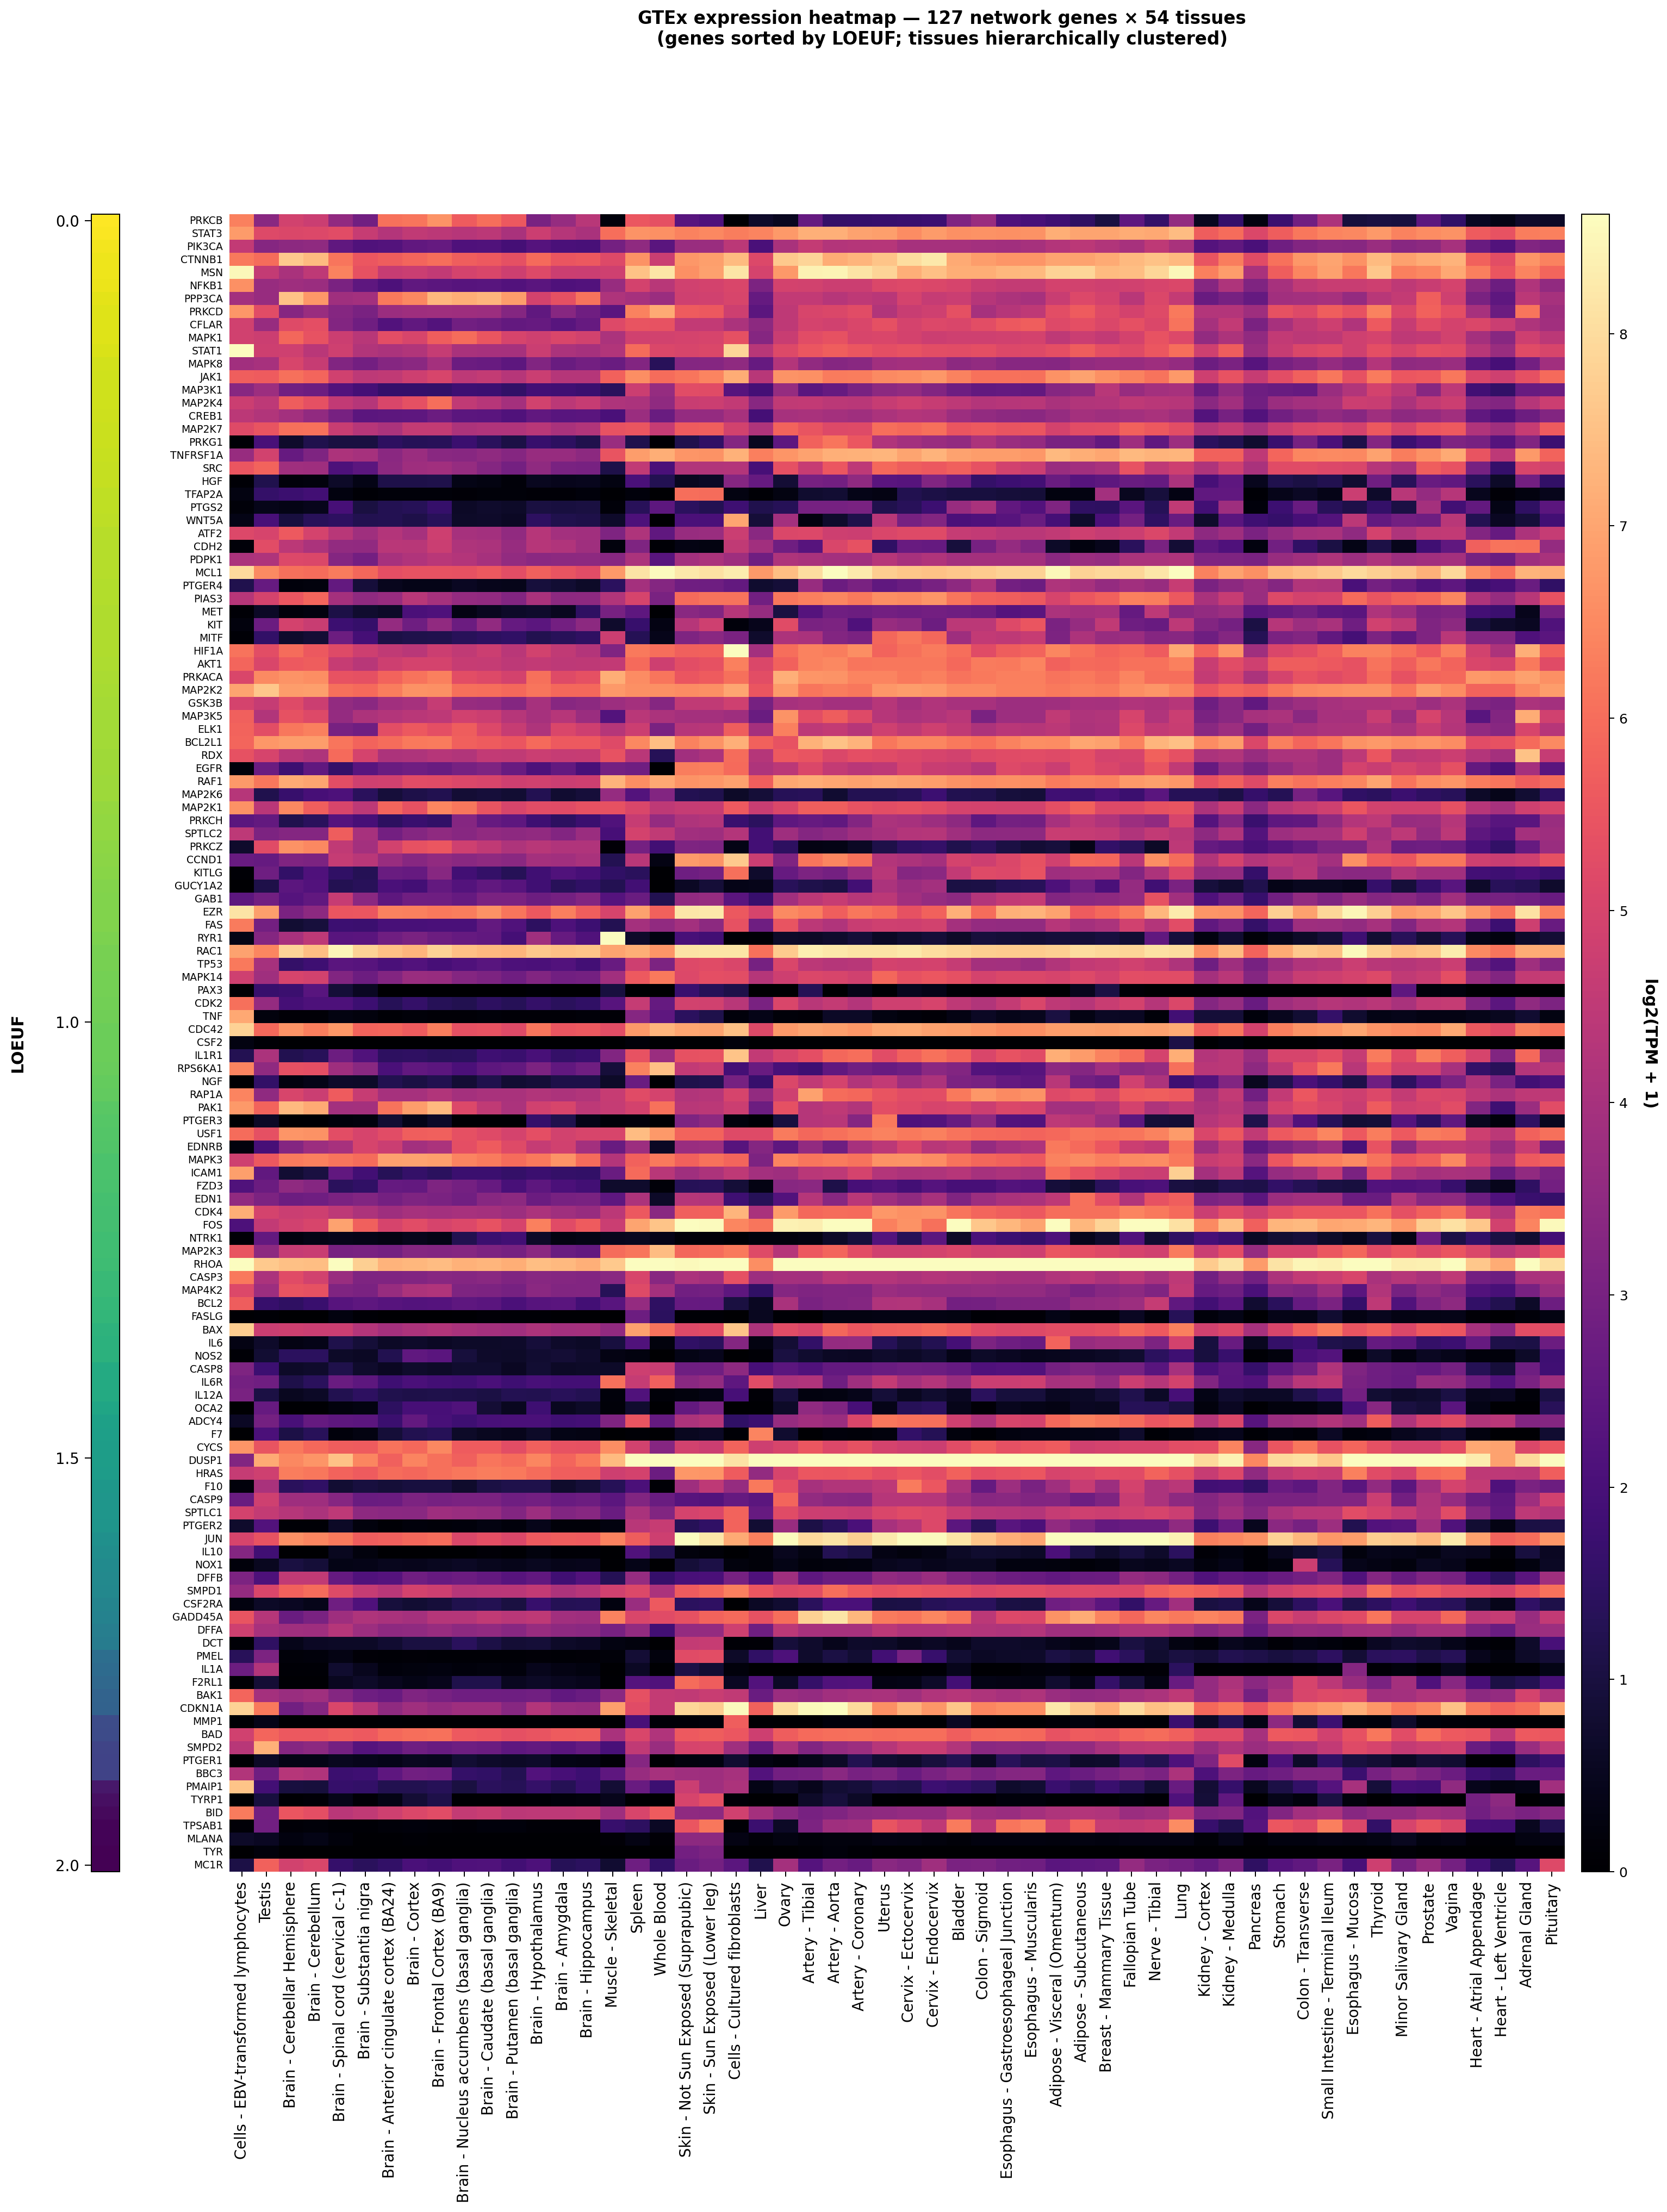
Phase 1.2 supplementary — Clustered expression heatmap
Genes (rows) sorted by LOEUF (top = most constrained) with functional category strip; tissues (columns) hierarchically clustered by co-expression (correlation distance). Color = log2(TPM + 1).
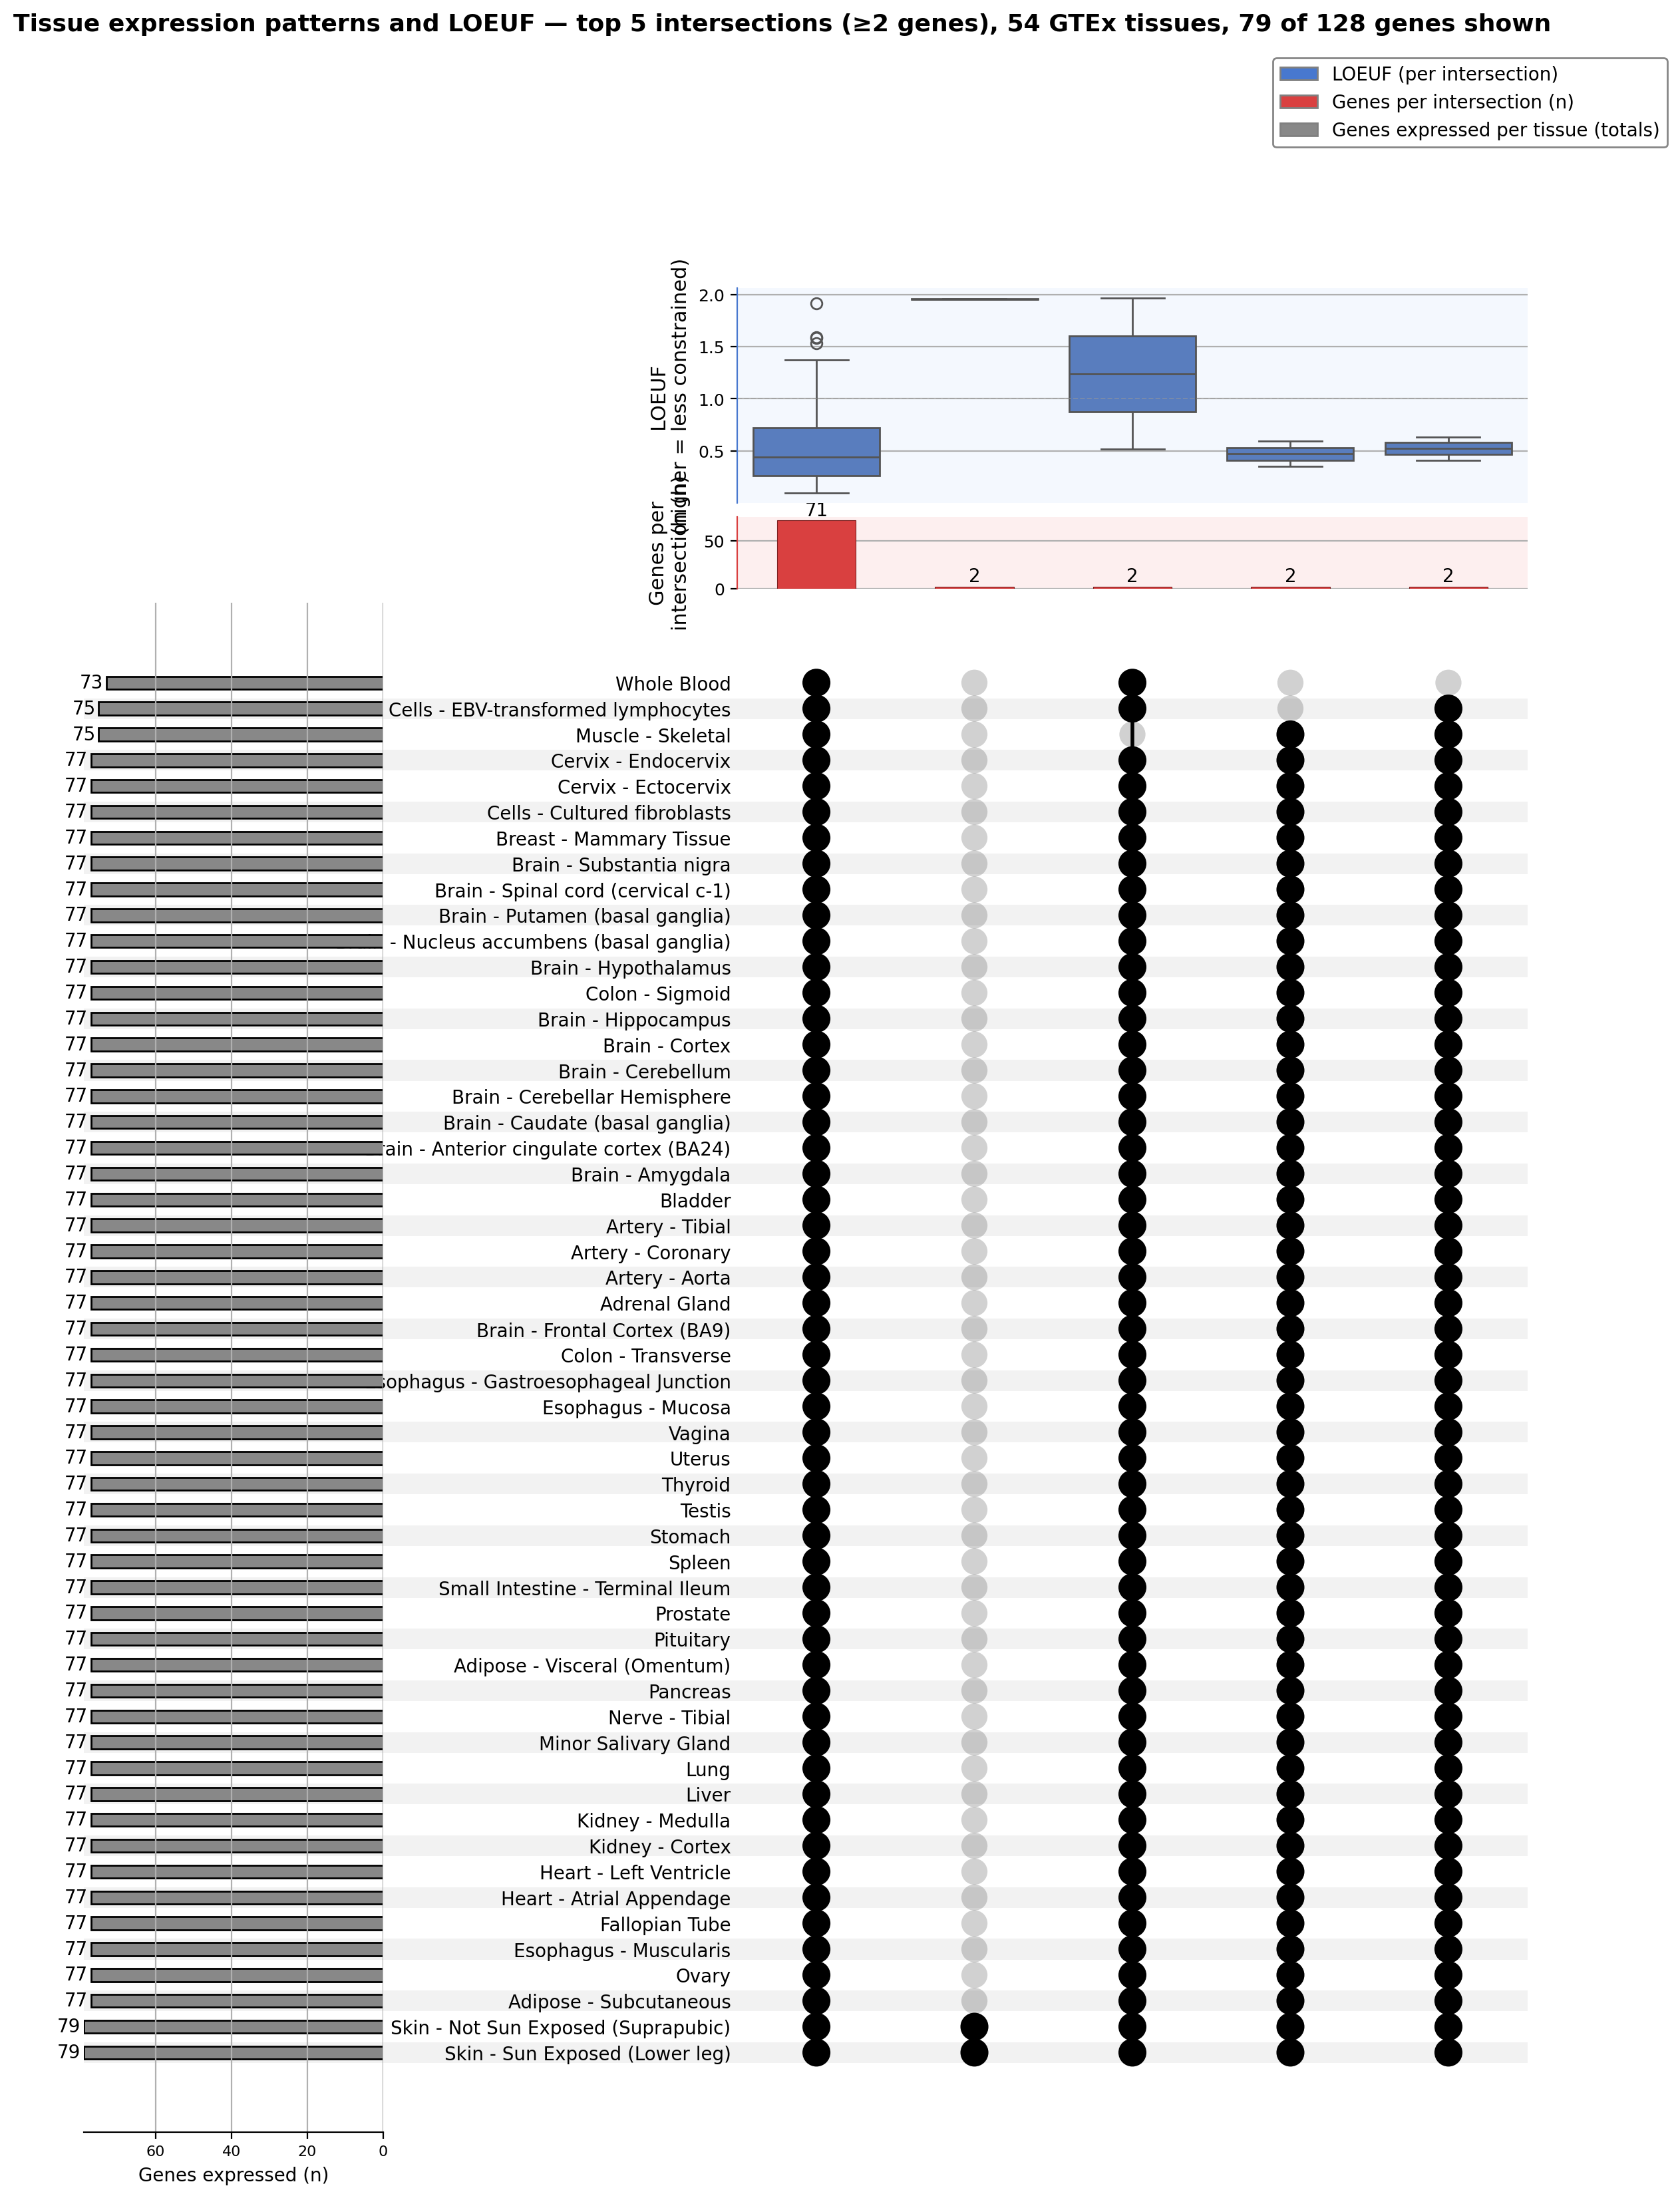
Phase 1.2 supplementary — UpSet plot of tissue intersections
Top intersections (≥2 genes) of expression across all 54 tissues, with LOEUF distribution per intersection. Most network genes (n = 71) are expressed in all 54 tissues — true housekeeping pattern.
Alternative categorizations (data-driven)
The hand-curated functional_category column (Pigment-specific, Developmental/NC, Generic signaling, etc.) comes from analysis/notebooks/melanogenesis_network_constraint_v2.ipynb and is persisted in data/LOEUF_by_functional_category.xlsx. To compare hand-curation against unbiased schemes, two additional categories are computed in analysis/phase1_new_categories.py and merged into data/network_constraint_categorized.csv.
gtex_tissue_category — derived from GTEx v8 expression
Computed on log2(TPM + 1) across all 54 GTEx tissues:
- τ (tau) — Yanai 2005 tissue specificity index. τ = 0 → uniform; τ = 1 → expressed in one tissue.
- n_expr — # tissues with median TPM > 1
- max_tissue — tissue with highest TPM
Decision tree (first match wins):
| Category | Rule |
|---|---|
| Housekeeping | τ < 0.4 AND n_expr ≥ 40 |
| Skin-restricted | τ ≥ 0.6 AND max_tissue ∈ skin |
| Brain-restricted | τ ≥ 0.6 AND max_tissue ∈ CNS / nerve / pituitary |
| Reproductive-restricted | τ ≥ 0.6 AND max_tissue ∈ gonads / uterus / cervix / prostate |
| Immune-restricted | τ ≥ 0.6 AND max_tissue ∈ blood / spleen / lymphocytes |
| Liver-restricted | τ ≥ 0.6 AND max_tissue == Liver |
| Other-restricted | τ ≥ 0.6 AND any other tissue |
| Broad | everything else (intermediate τ) |
Thresholds (τ ≥ 0.6, n_expr ≥ 40) follow conventions in the tissue-specificity literature (Sonawane 2017, Kryuchkova-Mostacci 2017). To change them, edit the constants at the top of phase1_new_categories.py.
kegg_primary_pathway — derived from KEGG pathway membership
analysis/fetch_kegg_pathways.py fetches link/pathway/hsa and list/pathway/hsa from the KEGG REST API and writes the long-form per-gene pathway list to data/kegg_pathway_lists.csv.
Each gene is assigned a single primary pathway using this priority order (first match wins, so pigmentation-specific Melanogenesis outranks generic signaling cascades):
| Priority | Pathway | KEGG ID |
|---|---|---|
| 1 | Melanogenesis | hsa04916 |
| 2 | MAPK signaling | hsa04010 |
| 3 | PI3K-Akt signaling | hsa04151 |
| 4 | Apoptosis | hsa04210 |
| 5 | Cytokine-cytokine receptor | hsa04060 |
| 6 | Wnt signaling | hsa04310 |
| 7 | JAK-STAT signaling | hsa04630 |
| 8 | NF-κB signaling | hsa04064 |
| 9 | Other (in KEGG) | (any pathway, none above) |
| 10 | Not in KEGG | (gene absent from KEGG hsa) |
Network gene counts under each scheme
GTEx tissue category:| Genes | |
|---|---|
| gtex_tissue_category | |
| Housekeeping | 61 |
| Broad | 31 |
| Other-restricted | 14 |
| Skin-restricted | 7 |
| Immune-restricted | 7 |
| Reproductive-restricted | 4 |
| Brain-restricted | 3 |
| Liver-restricted | 1 |
KEGG primary pathway:| Genes | |
|---|---|
| kegg_primary_pathway | |
| MAPK signaling | 36 |
| Other (in KEGG) | 29 |
| Melanogenesis | 23 |
| PI3K-Akt signaling | 14 |
| Apoptosis | 10 |
| Not in KEGG | 7 |
| Cytokine-cytokine receptor | 4 |
| JAK-STAT signaling | 3 |
| NF-kB signaling | 2 |
| Wnt signaling | 1 |
Cross-tabulation: GTEx category × KEGG pathway
| kegg_primary_pathway | Apoptosis | Cytokine-cytokine receptor | JAK-STAT signaling | MAPK signaling | Melanogenesis | NF-kB signaling | Not in KEGG | Other (in KEGG) | PI3K-Akt signaling | Wnt signaling |
|---|---|---|---|---|---|---|---|---|---|---|
| gtex_tissue_category | ||||||||||
| Brain-restricted | 0 | 0 | 0 | 0 | 1 | 0 | 0 | 2 | 0 | 0 |
| Broad | 1 | 0 | 1 | 9 | 7 | 1 | 0 | 7 | 5 | 0 |
| Housekeeping | 8 | 0 | 2 | 21 | 11 | 0 | 1 | 9 | 8 | 1 |
| Immune-restricted | 1 | 3 | 0 | 3 | 0 | 0 | 0 | 0 | 0 | 0 |
| Liver-restricted | 0 | 0 | 0 | 0 | 0 | 0 | 0 | 1 | 0 | 0 |
| Other-restricted | 0 | 1 | 0 | 1 | 1 | 1 | 2 | 7 | 1 | 0 |
| Reproductive-restricted | 0 | 0 | 0 | 2 | 0 | 0 | 0 | 2 | 0 | 0 |
| Skin-restricted | 0 | 0 | 0 | 0 | 3 | 0 | 3 | 1 | 0 | 0 |
Data provenance
| File | Description | Source |
|---|---|---|
data/phylop_scores.csv |
Mean PhyloP 100-way per gene (hg38) | UCSC REST API via analysis/fetch_phylop_scores.py |
data/GTEx_v8_gene_median_tpm.gct.gz |
GTEx v8 median TPM, 54 tissues | GTEx Portal (auto-downloaded) |
data/network_constraint_phylop.csv |
LOEUF + PhyloP merged | analysis/phase1_phylop_analysis.py |
data/network_constraint_gtex.csv |
LOEUF + tissue breadth merged | analysis/phase1_gtex_analysis.py |
data/gtex_tissue_membership.csv |
Per-gene boolean expression in all 54 GTEx tissues | analysis/phase1_gtex_upset.py |
output/table_phase1_gtex_per_tissue.csv |
ΔLOEUF and Mann-Whitney p per tissue | analysis/phase1_gtex_extras.py |
data/kegg_pathway_lists.csv |
Long-form gene × KEGG pathway membership with names | analysis/fetch_kegg_pathways.py |
data/network_constraint_categorized.csv |
Network LOEUF + tau, n_expr, max_tissue, gtex_tissue_category, kegg_primary_pathway | analysis/phase1_new_categories.py |