Phase 0 — Network Position & KEGG Connectivity
Betweenness centrality and KEGG pathway count vs. LoF intolerance
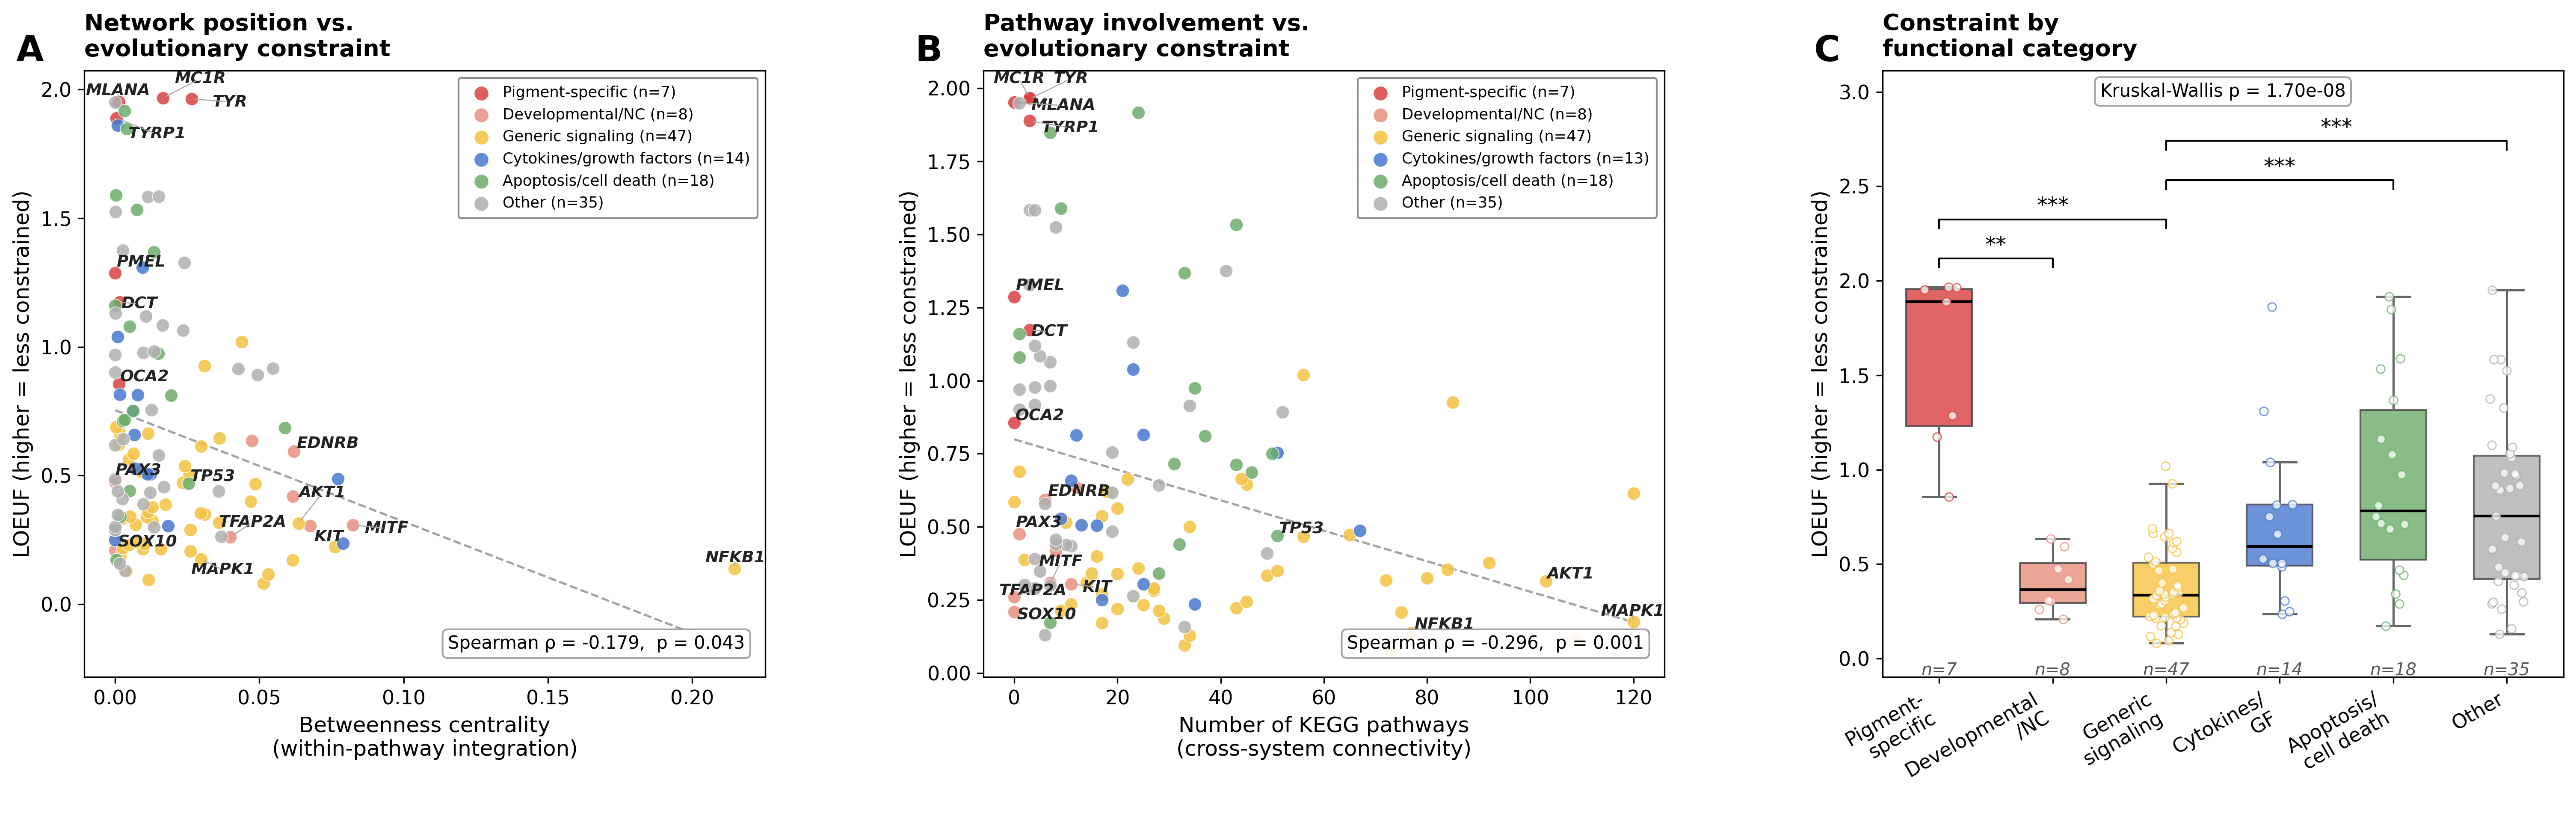
Overview
Phase 0 examines whether a gene’s structural position in the Raghunath (2015) melanocyte signaling network predicts how evolutionarily constrained it is. Two complementary network metrics are used:
Betweenness centrality — how often a gene sits on the shortest path between other genes in the network. Hub genes score high; peripheral genes score near zero. Values are from Raghunath et al. (2015).
KEGG pathway count — the number of KEGG biological pathways (hsa-*) in which a gene appears. Genes involved in many pathways occupy a broader functional niche and are expected to be under stronger constraint.
The central hypothesis: genes more central to the network are under stronger evolutionary constraint (lower LOEUF) because their disruption has wider downstream consequences.
Figure
Panel A — each of the 129 network genes plotted as betweenness centrality (x) vs. LOEUF (y). A negative relationship indicates that more central hub genes are more LoF-intolerant. The dashed line shows the OLS trend; key genes are labelled.
Panel B (requires data/kegg_pathway_counts.csv) — KEGG pathway count (x) vs. LOEUF (y). Genes participating in more KEGG pathways occupy a broader functional niche and are expected to be under stronger constraint.
Panel C — LOEUF distributions by functional category (boxplot). Median shown as a black line. Brackets mark Bonferroni-corrected significant pairs from Dunn’s posthoc test. This is the primary finding panel: pigment- specific genes are significantly more LoF-tolerant than generic signaling genes.
Betweenness centrality — summary statistics
n = 129 genes with betweenness centrality and LOEUF

Spearman ρ(betweenness_centrality, LOEUF) = -0.179, p = 4.289e-02
Kruskal-Wallis across functional categories: H = 15.90, p = 7.126e-03| N | Median | Mean | |
|---|---|---|---|
| functional_category | |||
| Pigment-specific | 7 | 0.0013 | 0.0068 |
| Developmental/NC | 8 | 0.0545 | 0.0451 |
| Generic signaling | 47 | 0.0129 | 0.0253 |
| Cytokines/growth factors | 14 | 0.0074 | 0.0170 |
| Apoptosis/cell death | 18 | 0.0045 | 0.0095 |
| Other | 35 | 0.0098 | 0.0125 |
KEGG pathway count — summary statistics
n = 128 genes with KEGG pathway count and LOEUF

Spearman ρ(kegg_pathway_count, LOEUF) = -0.296, p = 7.012e-04
Kruskal-Wallis across functional categories: H = 48.19, p = 3.246e-09| N | Median KEGG pathways | Mean KEGG pathways | |
|---|---|---|---|
| functional_category | |||
| Pigment-specific | 7 | 3.0 | 1.7 |
| Developmental/NC | 8 | 6.5 | 5.6 |
| Generic signaling | 47 | 33.0 | 43.3 |
| Cytokines/growth factors | 13 | 21.0 | 25.0 |
| Apoptosis/cell death | 18 | 31.5 | 26.8 |
| Other | 35 | 7.0 | 13.2 |
Key genes
| gene | functional_category | LOEUF | betweenness_centrality | kegg_pathway_count | |
|---|---|---|---|---|---|
| 0 | NFKB1 | Generic signaling | 0.138 | 0.214664 | 77.0 |
| 1 | MITF | Developmental/NC | 0.308 | 0.082398 | 7.0 |
| 2 | KIT | Developmental/NC | 0.305 | 0.067583 | 11.0 |
| 3 | AKT1 | Generic signaling | 0.315 | 0.063527 | 103.0 |
| 4 | MAPK1 | Generic signaling | 0.175 | 0.029841 | 120.0 |
| 5 | TYR | Pigment-specific | 1.964 | 0.026506 | 3.0 |
| 6 | TP53 | Apoptosis/cell death | 0.469 | 0.025518 | 51.0 |
| 7 | MC1R | Pigment-specific | 1.967 | 0.016532 | 3.0 |
| 8 | DCT | Pigment-specific | 1.174 | 0.001615 | 3.0 |
| 9 | OCA2 | Pigment-specific | 0.856 | 0.001296 | 0.0 |
| 10 | TYRP1 | Pigment-specific | 1.889 | 0.000396 | 3.0 |
| 11 | SOX10 | Developmental/NC | 0.209 | 0.000000 | 0.0 |
Interpretation
Betweenness centrality
Betweenness centrality is negatively correlated with LOEUF (Spearman ρ = -0.179, p = 4.289e-02) — significant. This supports the hypothesis that hub genes in the melanogenesis network are under stronger LoF constraint.
KEGG pathway connectivity
KEGG pathway count is negatively correlated with LOEUF (Spearman ρ = -0.296, p = 7.012e-04) — significant. Genes participating in more KEGG pathways tend to be more LoF-intolerant, consistent with broader functional roles imposing stronger selective constraint.
Data provenance
| File | Description | Source |
|---|---|---|
data/network_constraint_gtex.csv |
LOEUF + betweenness centrality | analysis/phase1_gtex_analysis.py; centrality from Raghunath et al. (2015) |
data/kegg_pathway_counts.csv |
KEGG pathway count per gene | analysis/fetch_kegg_pathways.py; KEGG REST API |
Analysis script: analysis/phase0_network_constraint.py