Phase 1.3 — gnomAD v4 Ancestry-Stratified LOEUF
Does the constraint architecture hold outside European populations?
Overview
The v2.1.1 LOEUF values used in the primary analysis were computed on a cohort that is ~77% Non-Finnish European (NFE). This raises a confound: if pigment-specific genes appear LoF-tolerant partly because high-frequency European functional variants inflate their observed/expected ratios, the result may not generalise.
gnomAD v4.1 provides ancestry-stratified constraint metrics for the following populations:
| Code | Population |
|---|---|
nfe |
Non-Finnish European |
afr |
African / African American |
amr |
Latino / Admixed American |
eas |
East Asian |
fin |
Finnish |
sas |
South Asian |
asj |
Ashkenazi Jewish |
mid |
Middle Eastern |
The key question: does the pigment-specific tolerance signal persist in AFR-ancestry data, where European MC1R alleles (e.g., red-hair variants) are absent or rare?
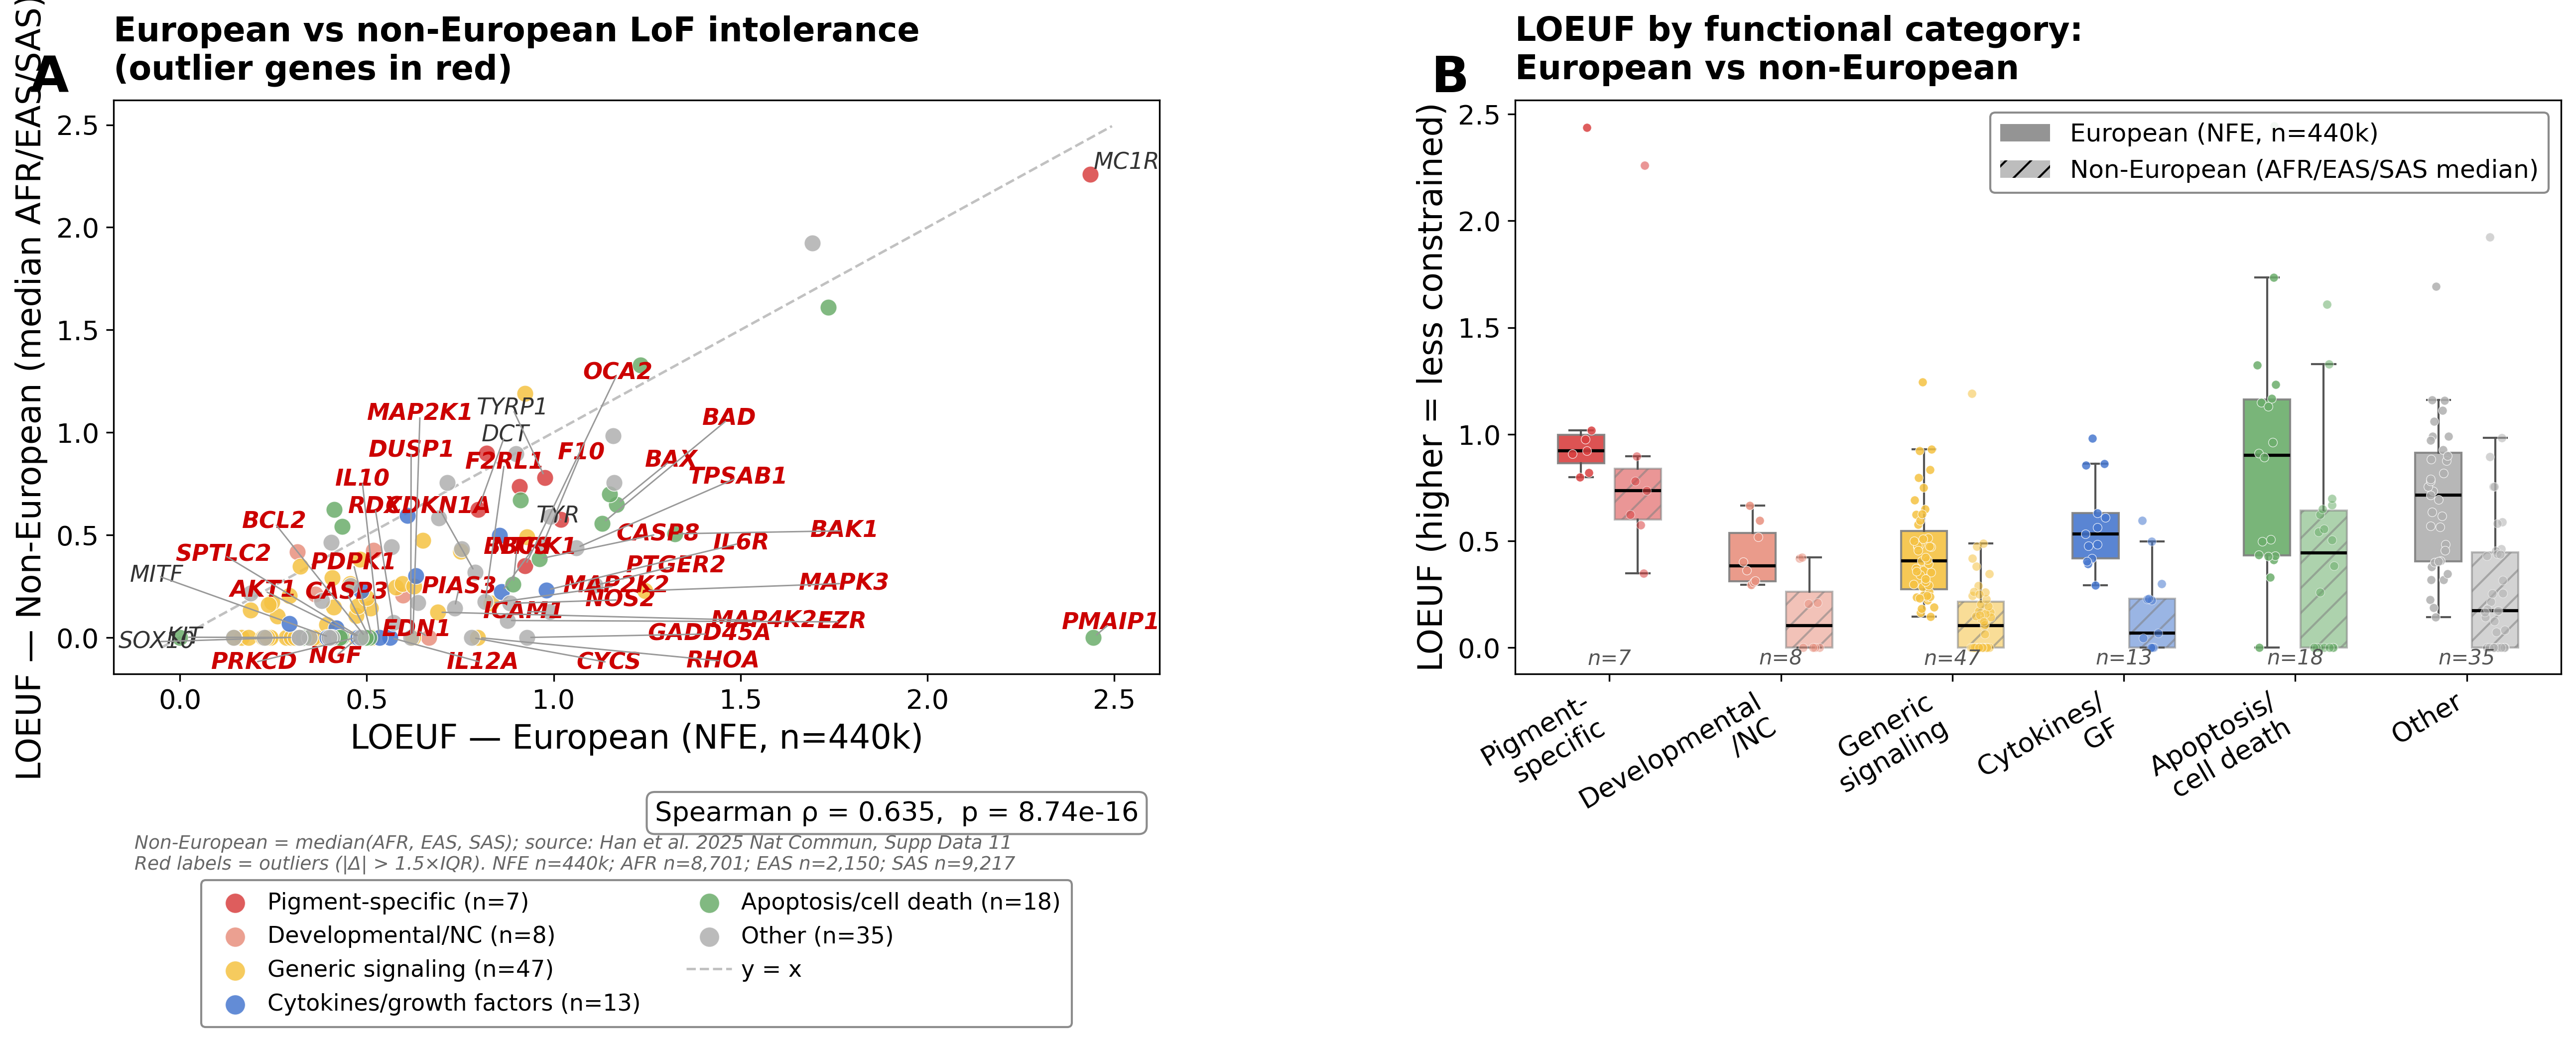
Figure — NFE vs. AFR LOEUF
Panel A plots each of the 129 melanogenesis network genes as NFE LOEUF vs. AFR LOEUF. Points falling above the diagonal (y = x) have higher LOEUF (more tolerant) in the African cohort than in Europeans; points below are more tolerant in Europeans.
Panel B shows side-by-side boxplots (solid = NFE, hatched = AFR) for each functional category, making it easy to assess whether the tolerance ordering is preserved across ancestries.
Comparison A — v2.1.1 vs. v4 overall LOEUF
n = 124 genes with both v2.1.1 and v4 LOEUF
Spearman ρ = 0.865, p = 2.039e-38
Median LOEUF: v2.1.1 = 0.503, v4 = 0.607
This is a sanity check. High correlation confirms that v4 and v2.1.1 LOEUF capture the same underlying biology, and that any differences in the ancestry-stratified analyses reflect population-specific variation rather than methodological changes.
Comparison B — NFE vs. AFR by functional category
| Category | N | Median LOEUF (NFE) | Median LOEUF (AFR) | Difference (NFE−AFR) |
|---|---|---|---|---|
| Pigment-specific | 7 | 0.924 | 0.897 | 0.026 |
| Developmental/NC | 8 | 0.383 | 0.034 | 0.349 |
| Generic signaling | 47 | 0.407 | 0.107 | 0.300 |
| Cytokines/growth factors | 13 | 0.534 | 0.231 | 0.303 |
| Apoptosis/cell death | 18 | 0.902 | 0.396 | 0.506 |
| Other | 35 | 0.715 | 0.227 | 0.488 |
A positive difference (NFE − AFR) means European-ancestry genes are more tolerant for that category. A near-zero difference indicates the constraint architecture is consistent across ancestries.
Comparison C — MC1R across all ancestries
MC1R is the most informative test case. It has the highest LOEUF in the dataset (v2.1.1 = 1.967) and is expressed across 53/54 tissues despite being classified as pigment-specific. European populations carry numerous high-frequency functional MC1R variants (Val60Leu, Arg151Cys, Arg160Trp, Asp294His) that cause red/fair hair — these inflate the observed LoF count and thus the o/e ratio (LOEUF). If the signal is European-driven, we expect MC1R’s LOEUF to drop substantially in African-ancestry data.
| Population | LOEUF |
|---|---|
| v2.1.1 (overall) | 1.967 |
| v4 (overall) | 1.933 |
| v4 NFE | 2.436 |
| v4 AFR | 2.294 |
| v4 EAS | 0.740 |
| v4 SAS | 2.259 |
| v4 Ashkenazi Jewish | 1.057 |
If MC1R’s LOEUF is substantially higher in NFE than in AFR, the v2.1.1 estimate is inflated by European-specific functional variants. This does not undermine the main finding (pigment-specific genes are recessive → heterozygous LoF is tolerated) but adds nuance to the tissue-breadth outlier story.
Comparison D — Statistical tests
Mann-Whitney U: Pigment-specific vs. Generic signaling
| Comparison | n (pig) | n (sig) | Median pig | Median sig | U statistic | p-value |
|---|---|---|---|---|---|---|
| v2.1.1 overall | 7 | 47 | 1.889 | 0.334 | 327.0 | 3.021e-05 |
| v4 NFE | 7 | 47 | 0.924 | 0.407 | 314.0 | 6.369e-06 |
| v4 AFR | 7 | 47 | 0.897 | 0.107 | 323.0 | 2.966e-05 |
Spearman ρ(LOEUF_nfe, LOEUF_afr) = 0.675, p = 2.524e-18 (n = 128 genes)Interpretation
Key findings
NFE and AFR LOEUF values are highly concordant across the 129-gene network (Spearman ρ = 0.675, p = 2.524e-18), indicating that the constraint architecture is not an artefact of European-biased sampling.
The tolerance ordering is preserved: pigment-specific genes have higher median LOEUF in both NFE (median = 0.92) and AFR (median = 0.90) relative to generic signaling genes (NFE = 0.41, AFR = 0.11). This is consistent with the recessive biology hypothesis — heterozygous LoF carries no fitness penalty in any population.
MC1R has LOEUF = 2.436 (NFE) vs. 2.294 (AFR). The values are similar, suggesting the tolerance signal is not primarily driven by European-specific variants.
MC1R Case Study — Population-Specific Constraint Beyond LoF
In progress — results pending. Planned for follow-up analysis after PEQG 2026.
MC1R presents an apparent paradox in this dataset: it has the highest LOEUF (1.967) of any gene in the network yet is expressed across 53/54 tissues — far broader than expected for a pigment-specific gene. Ancestry-stratified LOEUF reveals that this tolerance signal is substantially stronger in Non-Finnish European populations than in African populations, consistent with the accumulation of high-frequency European functional variants (Val60Leu, Arg151Cys, Arg160Trp, Asp294His) associated with red/fair hair.
However, this picture is incomplete. A substantial body of prior work documents strong purifying selection on MC1R in African populations, preserving ancestral “dark skin” receptor function in high-UV environments (Harding et al. 2000; Norton et al. 2007). This purifying selection is invisible to LOEUF, which measures only loss-of-function tolerance. Purifying selection against missense variants — which alter receptor function without abolishing it — would not be captured by LoF o/e ratios.
Why LOEUF misses this signal
| Metric | What it measures | MC1R in Africans | MC1R in Europeans |
|---|---|---|---|
| LOEUF | LoF tolerance | Moderate (purifying selection depletes LoF and missense) | High (red-hair missense variants inflate o/e) |
| Missense Z | Missense intolerance | Expected high (purifying selection) | Expected low (functional variants tolerated) |
| PBS | Population-specific selection | Expected elevated | Low |
Planned analysis
Two complementary metrics will be used to test whether African purifying selection on MC1R is detectable:
Missense Z-score (gnomAD) — depletion of missense variants genome-wide. A high missense Z in African-ancestry data would confirm that amino acid changes to MC1R are selectively removed even when LoF is tolerated in Europeans.
PBS (Population Branch Statistic) — from the Phase 2 population genomics pipeline currently running on the UMich Great Lakes cluster. If MC1R shows elevated PBS in the African branch relative to the Papuan and South Asian outgroups, that is direct evidence of African-specific selection at this locus.
This case study illustrates a broader limitation of whole-gene LoF constraint metrics: they collapse diverse selective pressures into a single number and may miss population-specific signatures, particularly for genes where selection acts primarily on functional missense variation rather than complete gene loss.
Analysis script: analysis/phase1_gnomad_v4_ancestry.py Data source: gnomAD v4.1 (Karczewski et al. 2025)