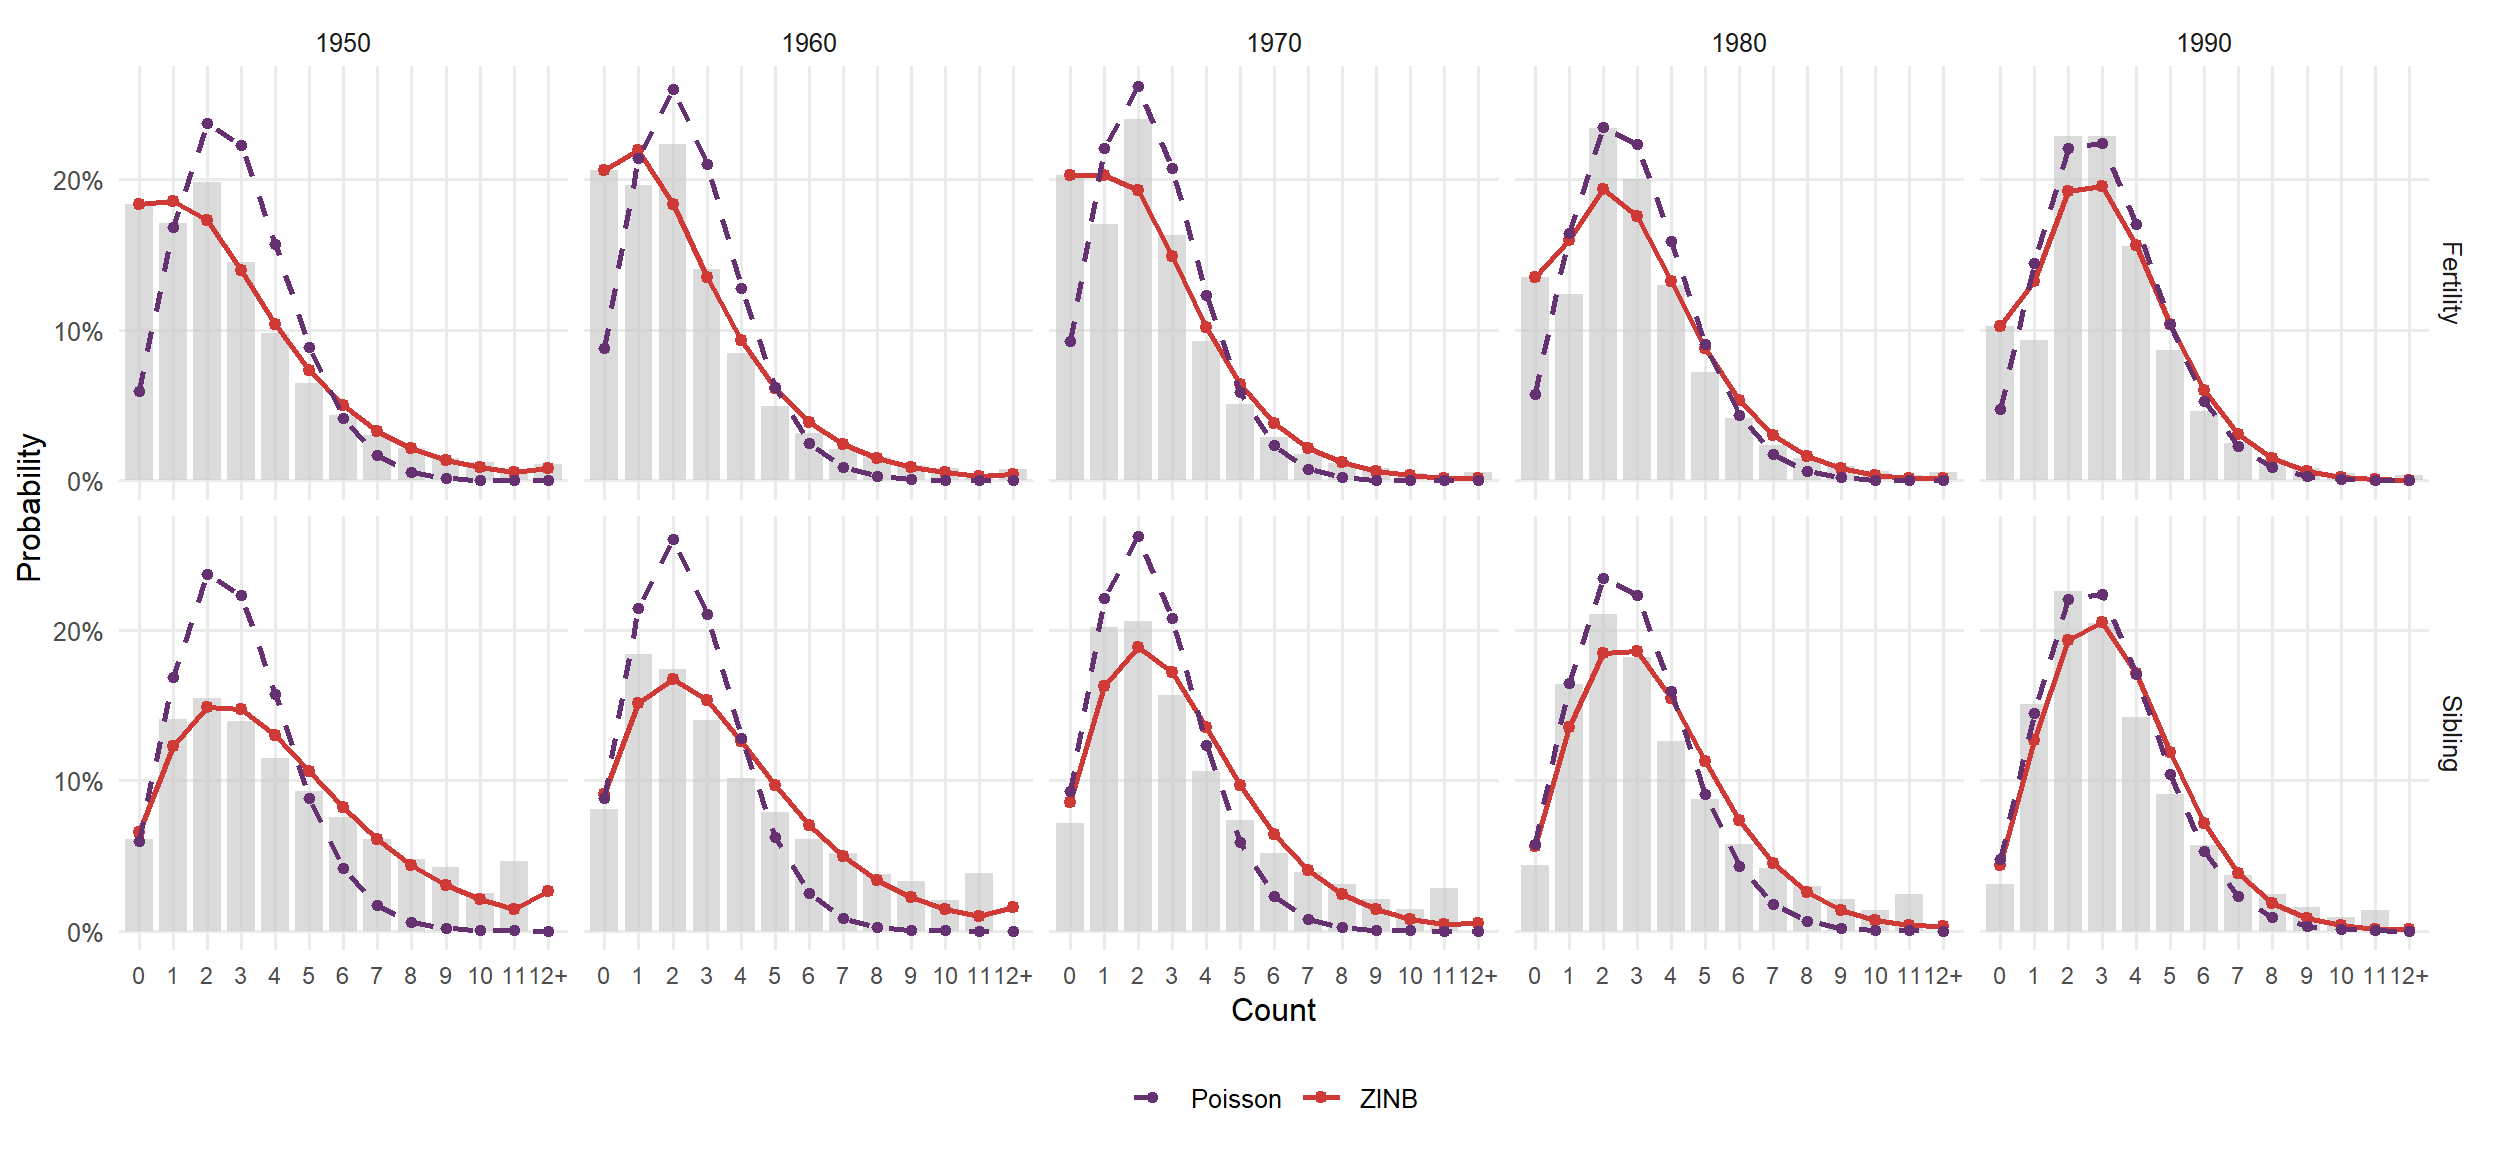
max_input_count <- 12L

zinb_pmf <- function(k, mu, size, pi0) {
  ifelse(
    k == 0L,
    pi0 + (1 - pi0) * dnbinom(k, size = size, mu = mu),
    (1 - pi0) * dnbinom(k, size = size, mu = mu)
  )
}

tail_pmf <- function(values) {
  pmax(0, 1 - sum(values))
}

model_pmf_for_year <- function(year) {
  z <- zinb_params %>% filter(Year == year)
  p <- pois_params %>% filter(Year == year)
  k <- 0:(max_input_count - 1L)

  fert_zinb <- zinb_pmf(k, mu = z$mu, size = z$size, pi0 = z$pi0)
  fert_pois <- dpois(k, lambda = p$mu)
  sib_zinb <- dnbinom(k, size = z$size + 1, mu = z$mu * (z$size + 1) / z$size)
  sib_pois <- dpois(k, lambda = p$mu)

  bind_rows(
    tibble(Year = year, Distribution = "Fertility", Count = c(k, max_input_count),
           poissonFit = c(fert_pois, tail_pmf(fert_pois)),
           zinbFit = c(fert_zinb, tail_pmf(fert_zinb))),
    tibble(Year = year, Distribution = "Sibling", Count = c(k, max_input_count),
           poissonFit = c(sib_pois, tail_pmf(sib_pois)),
           zinbFit = c(sib_zinb, tail_pmf(sib_zinb)))
  )
}

emp_fert_pmf <- read_csv(
  file.path(processed_path, "ipums_fertility_pmf_by_cohort.csv"),
  show_col_types = FALSE
) %>%
  filter(Year %in% all_census_years) %>%
  group_by(Year, cohort, Count = pmin(children, max_input_count)) %>%
  summarise(empirical = sum(probability), .groups = "drop") %>%
  mutate(Distribution = "Fertility")

emp_sib_pmf <- emp_fert_pmf %>%
  filter(Distribution == "Fertility") %>%
  group_by(Year, cohort) %>%
  group_modify(~ {
    probs <- numeric(max_input_count + 1L)
    probs[.x$Count + 1L] <- .x$empirical
    fert_mean <- fert_estimation$mean_data[
      fert_estimation$distribution == "fertility" &
        fert_estimation$Year == .y$Year
    ]
    known <- (1:max_input_count) * probs[2:(max_input_count + 1L)] / fert_mean
    tibble(
      Count = 0:max_input_count,
      empirical = c(known, pmax(0, 1 - sum(known))),
      Distribution = "Sibling"
    )
  }) %>%
  ungroup()

input_model_pmf <- bind_rows(lapply(all_census_years, model_pmf_for_year))

input_pmf <- bind_rows(emp_fert_pmf, emp_sib_pmf) %>%
  left_join(input_model_pmf, by = c("Year", "Distribution", "Count")) %>%
  mutate(
    CountLabel = factor(
      if_else(Count == max_input_count, paste0(max_input_count, "+"), as.character(Count)),
      levels = c(as.character(0:(max_input_count - 1L)), paste0(max_input_count, "+"))
    ),
    Year = factor(Year, levels = all_census_years),
    Distribution = factor(Distribution, levels = c("Fertility", "Sibling"))
  )

ggplot(input_pmf, aes(x = CountLabel)) +
  geom_col(aes(y = empirical), fill = empirical_fill, alpha = 0.65, width = 0.82) +
  geom_line(aes(y = zinbFit, group = 1, color = "ZINB"), linewidth = 1) +
  geom_point(aes(y = zinbFit, color = "ZINB"), size = 1.8) +
  geom_line(aes(y = poissonFit, group = 1, color = "Poisson"), linewidth = 0.9, linetype = "dashed") +
  geom_point(aes(y = poissonFit, color = "Poisson"), size = 1.6) +
  facet_grid(Distribution ~ Year) +
  scale_color_manual(values = model_fit_palette, name = NULL) +
  scale_y_continuous(labels = function(x) paste0(round(100 * x), "%")) +
  labs(x = "Count", y = "Probability") +
  theme_minimal(base_size = 12) +
  theme(
    legend.position = "bottom",
    panel.grid.minor = element_blank(),
    axis.text.x = element_text(size = 9)
  )