BioSkin validation
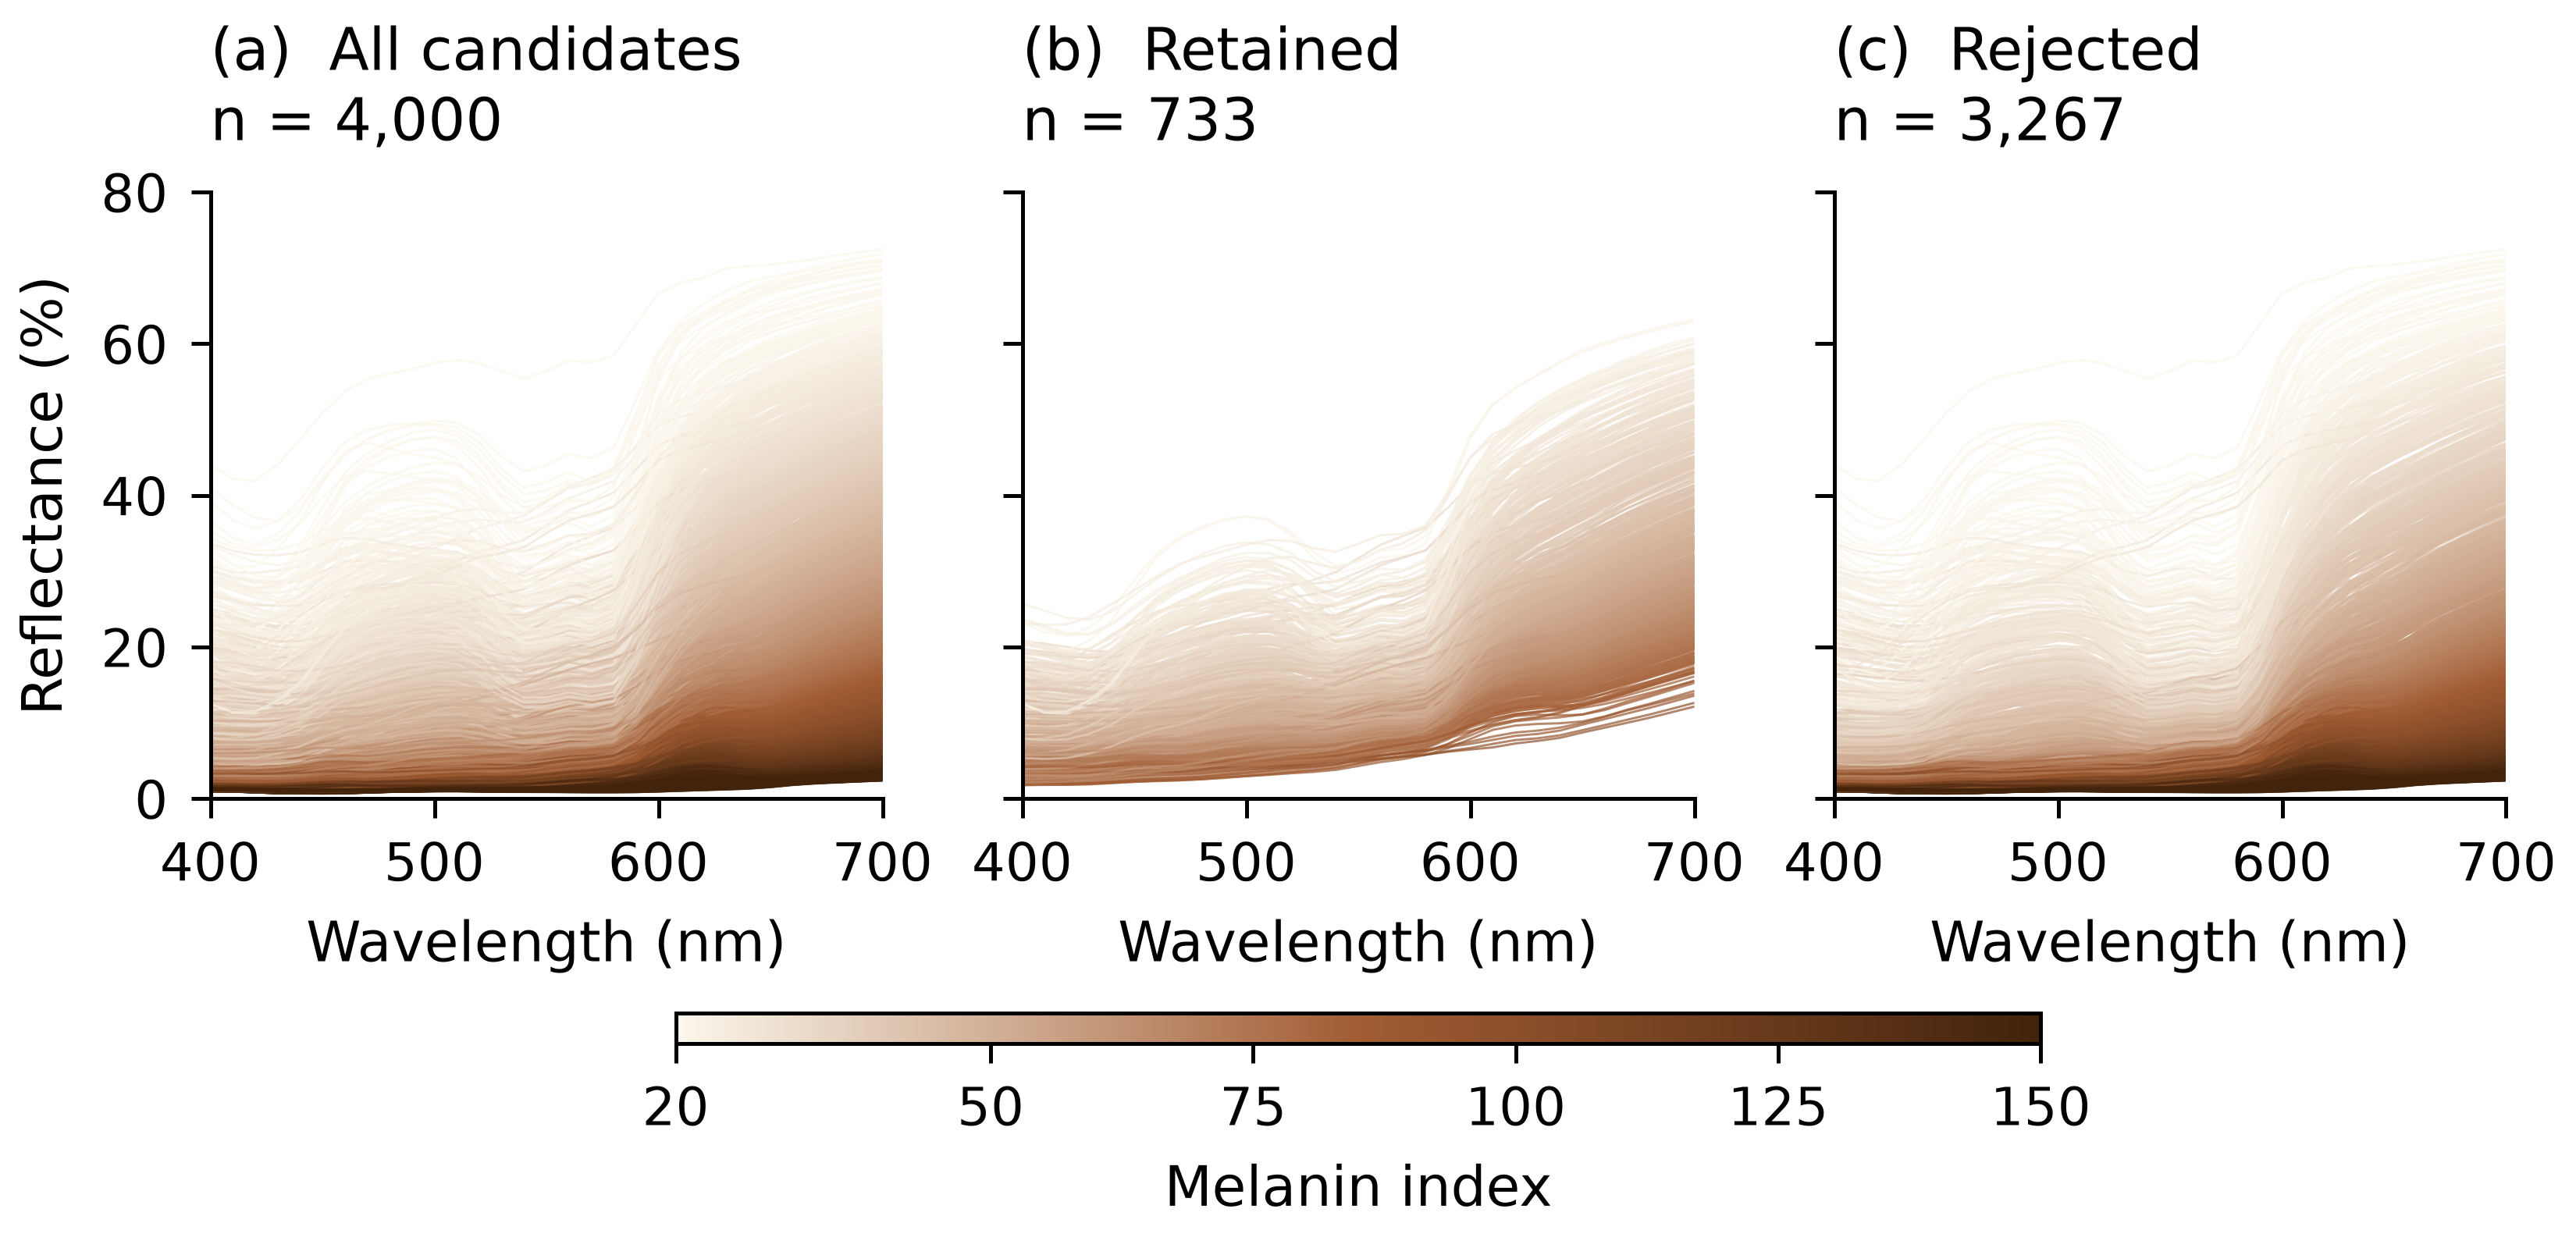
We evaluate 4,000 BioSkin-generated spectra against the International Skin Spectra Archive (ISSA) using MI–EI screening followed by a conditional spectral assessment. 733 spectra (18.325%) pass both stages.
The executed BVCM notebook contains the complete analysis. The rerun report documents the input correction, parameter pairing, and changes relative to the previous dataset.
1 Validation results
| Outcome | Number of spectra | Percentage and denominator |
|---|---|---|
| Candidates | 4,000 | 100% of all candidates |
| Passed MI–EI screening | 1,167 | 29.175% of 4,000 |
| Rejected at Stage 1 | 2,833 | 70.825% of 4,000 |
| Passed conditional spectral assessment | 733 | 62.8% of 1,167 Stage 1 passes |
| Rejected at Stage 2 | 434 | 37.2% of 1,167 Stage 1 passes |
| Passed both stages | 733 | 18.325% of 4,000 |
| Rejected overall | 3,267 | 81.675% of 4,000 |
Stage 2 is evaluated only after a Stage 1 pass. Its Mahalanobis-distance cutoff is 9.4114149808, the 95th percentile of the ISSA training distances. Rejection indicates inconsistency with this empirical reference under the chosen criteria; it does not establish biological implausibility.
2 Physical parameters
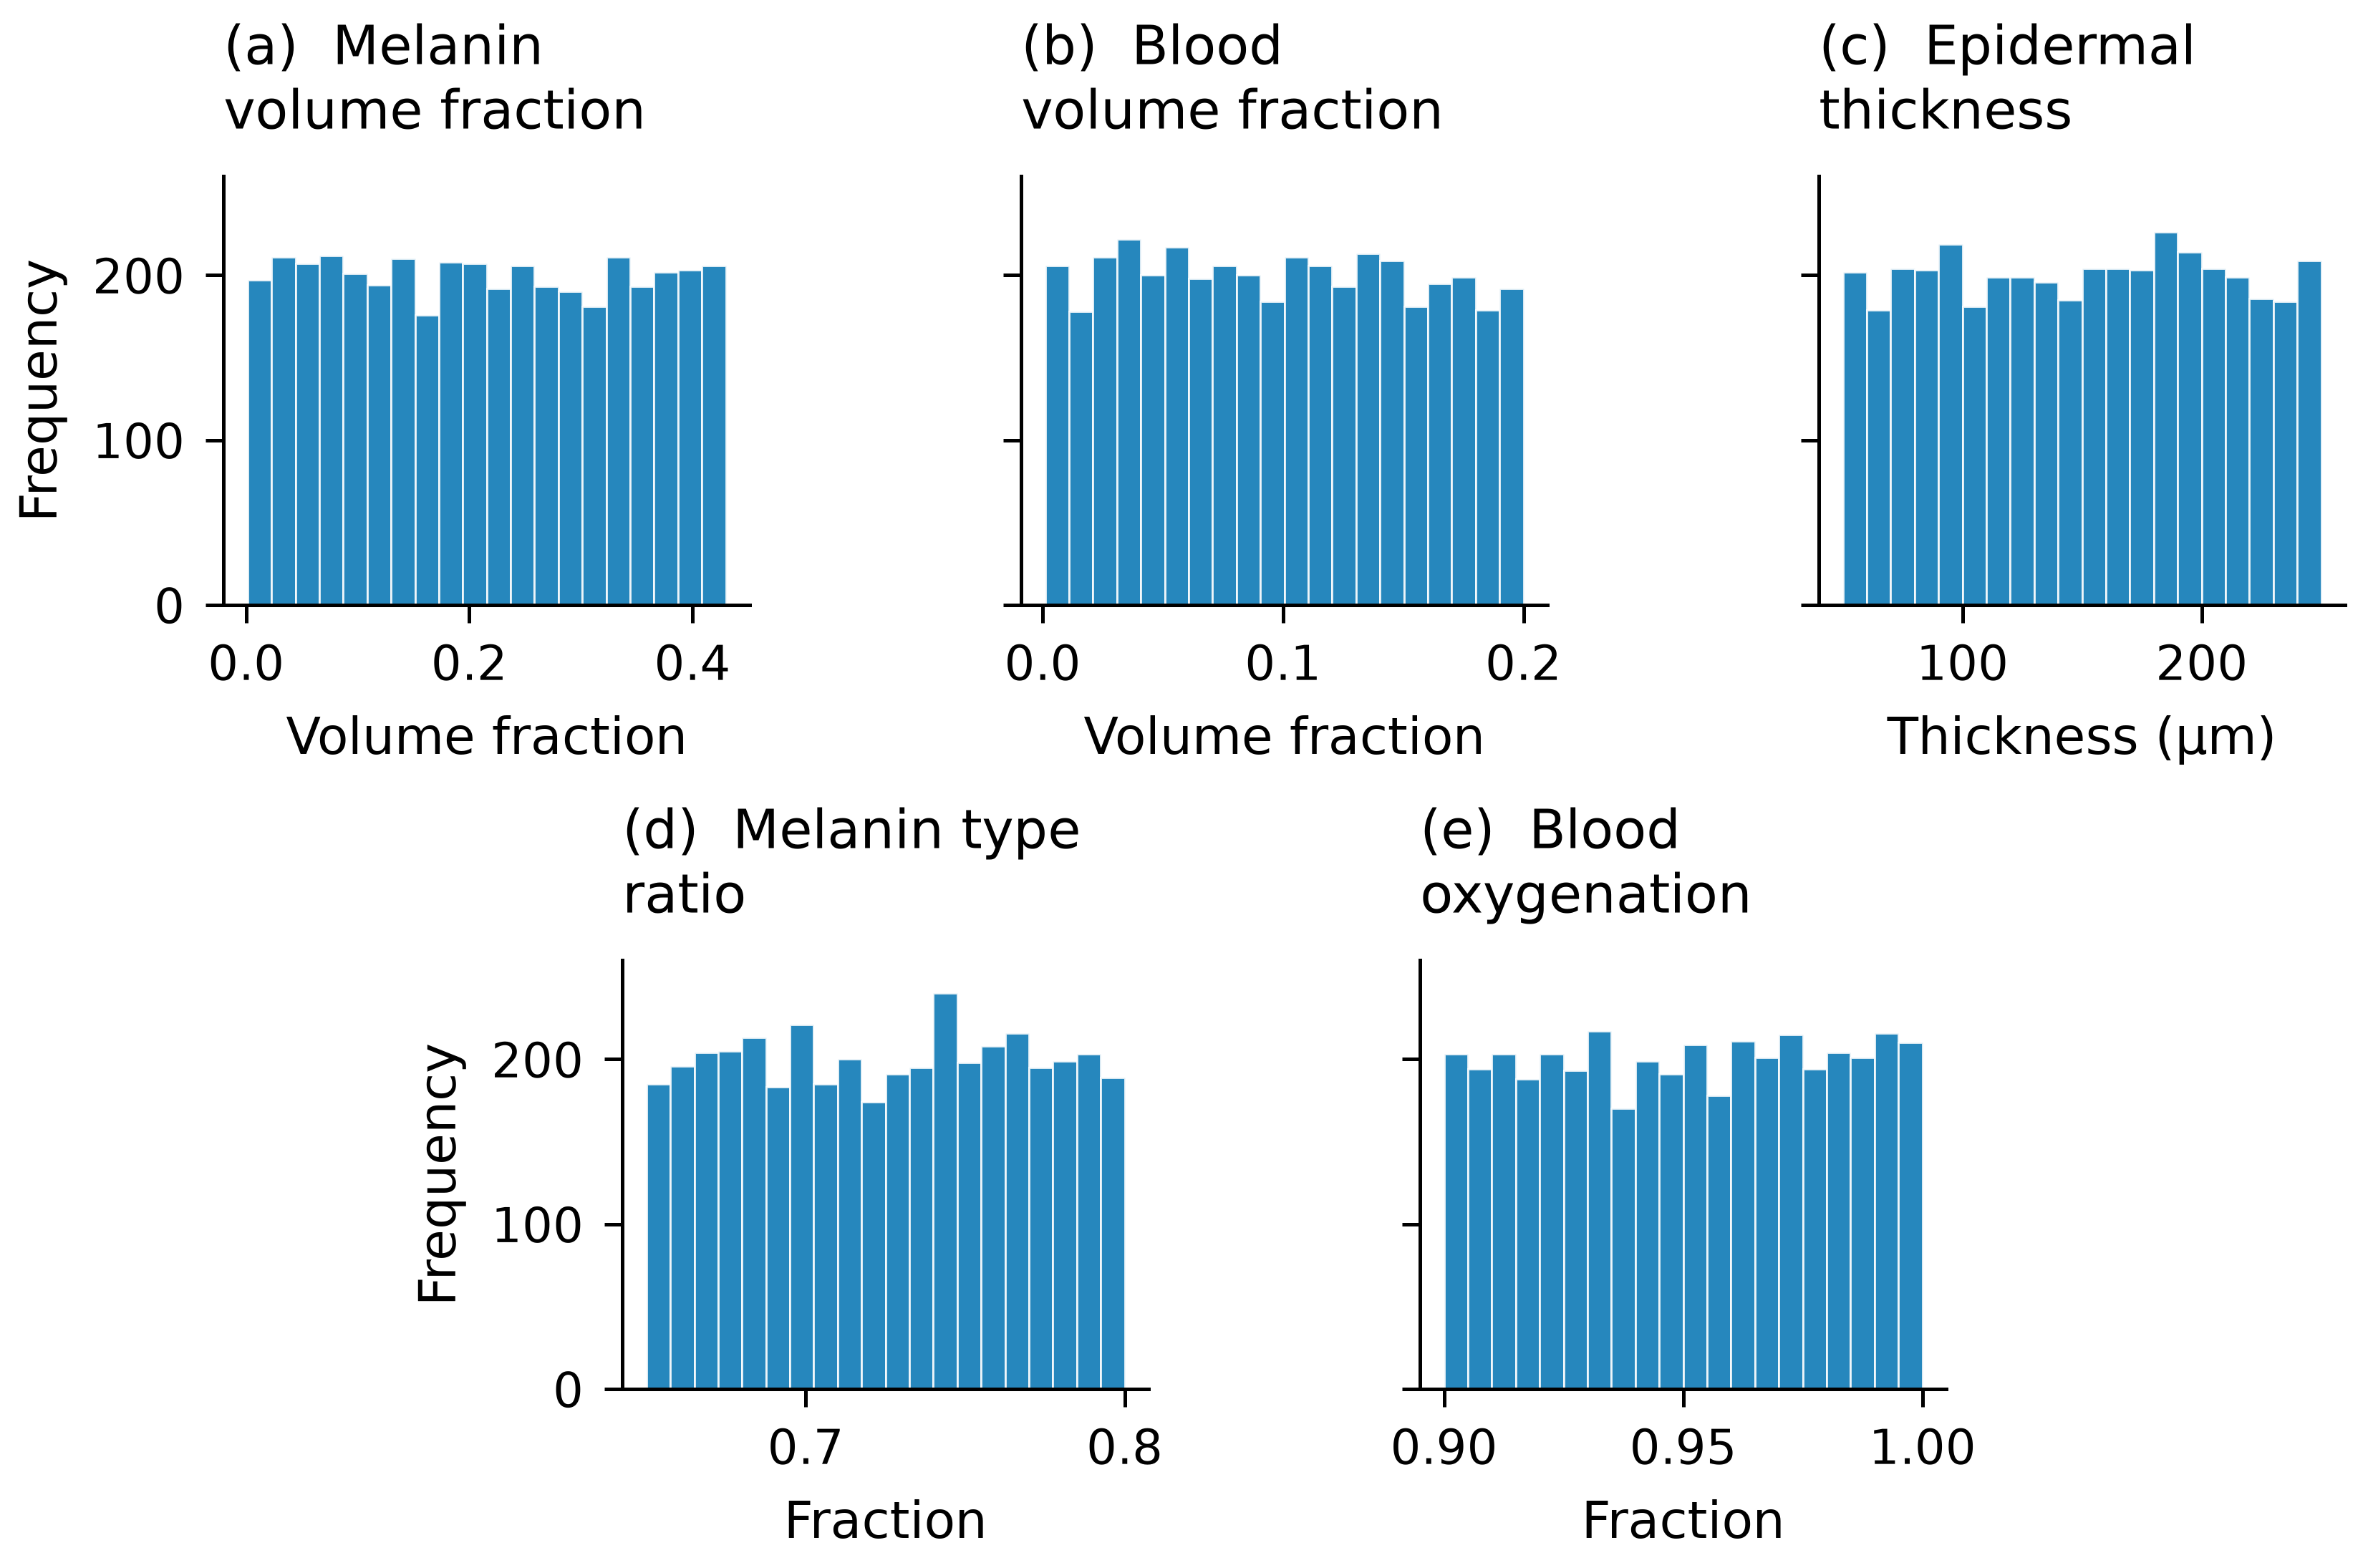
The inputs comprise melanin volume fraction, blood volume fraction, epidermal thickness, melanin type ratio, and blood oxygenation.
3 PCA comparison
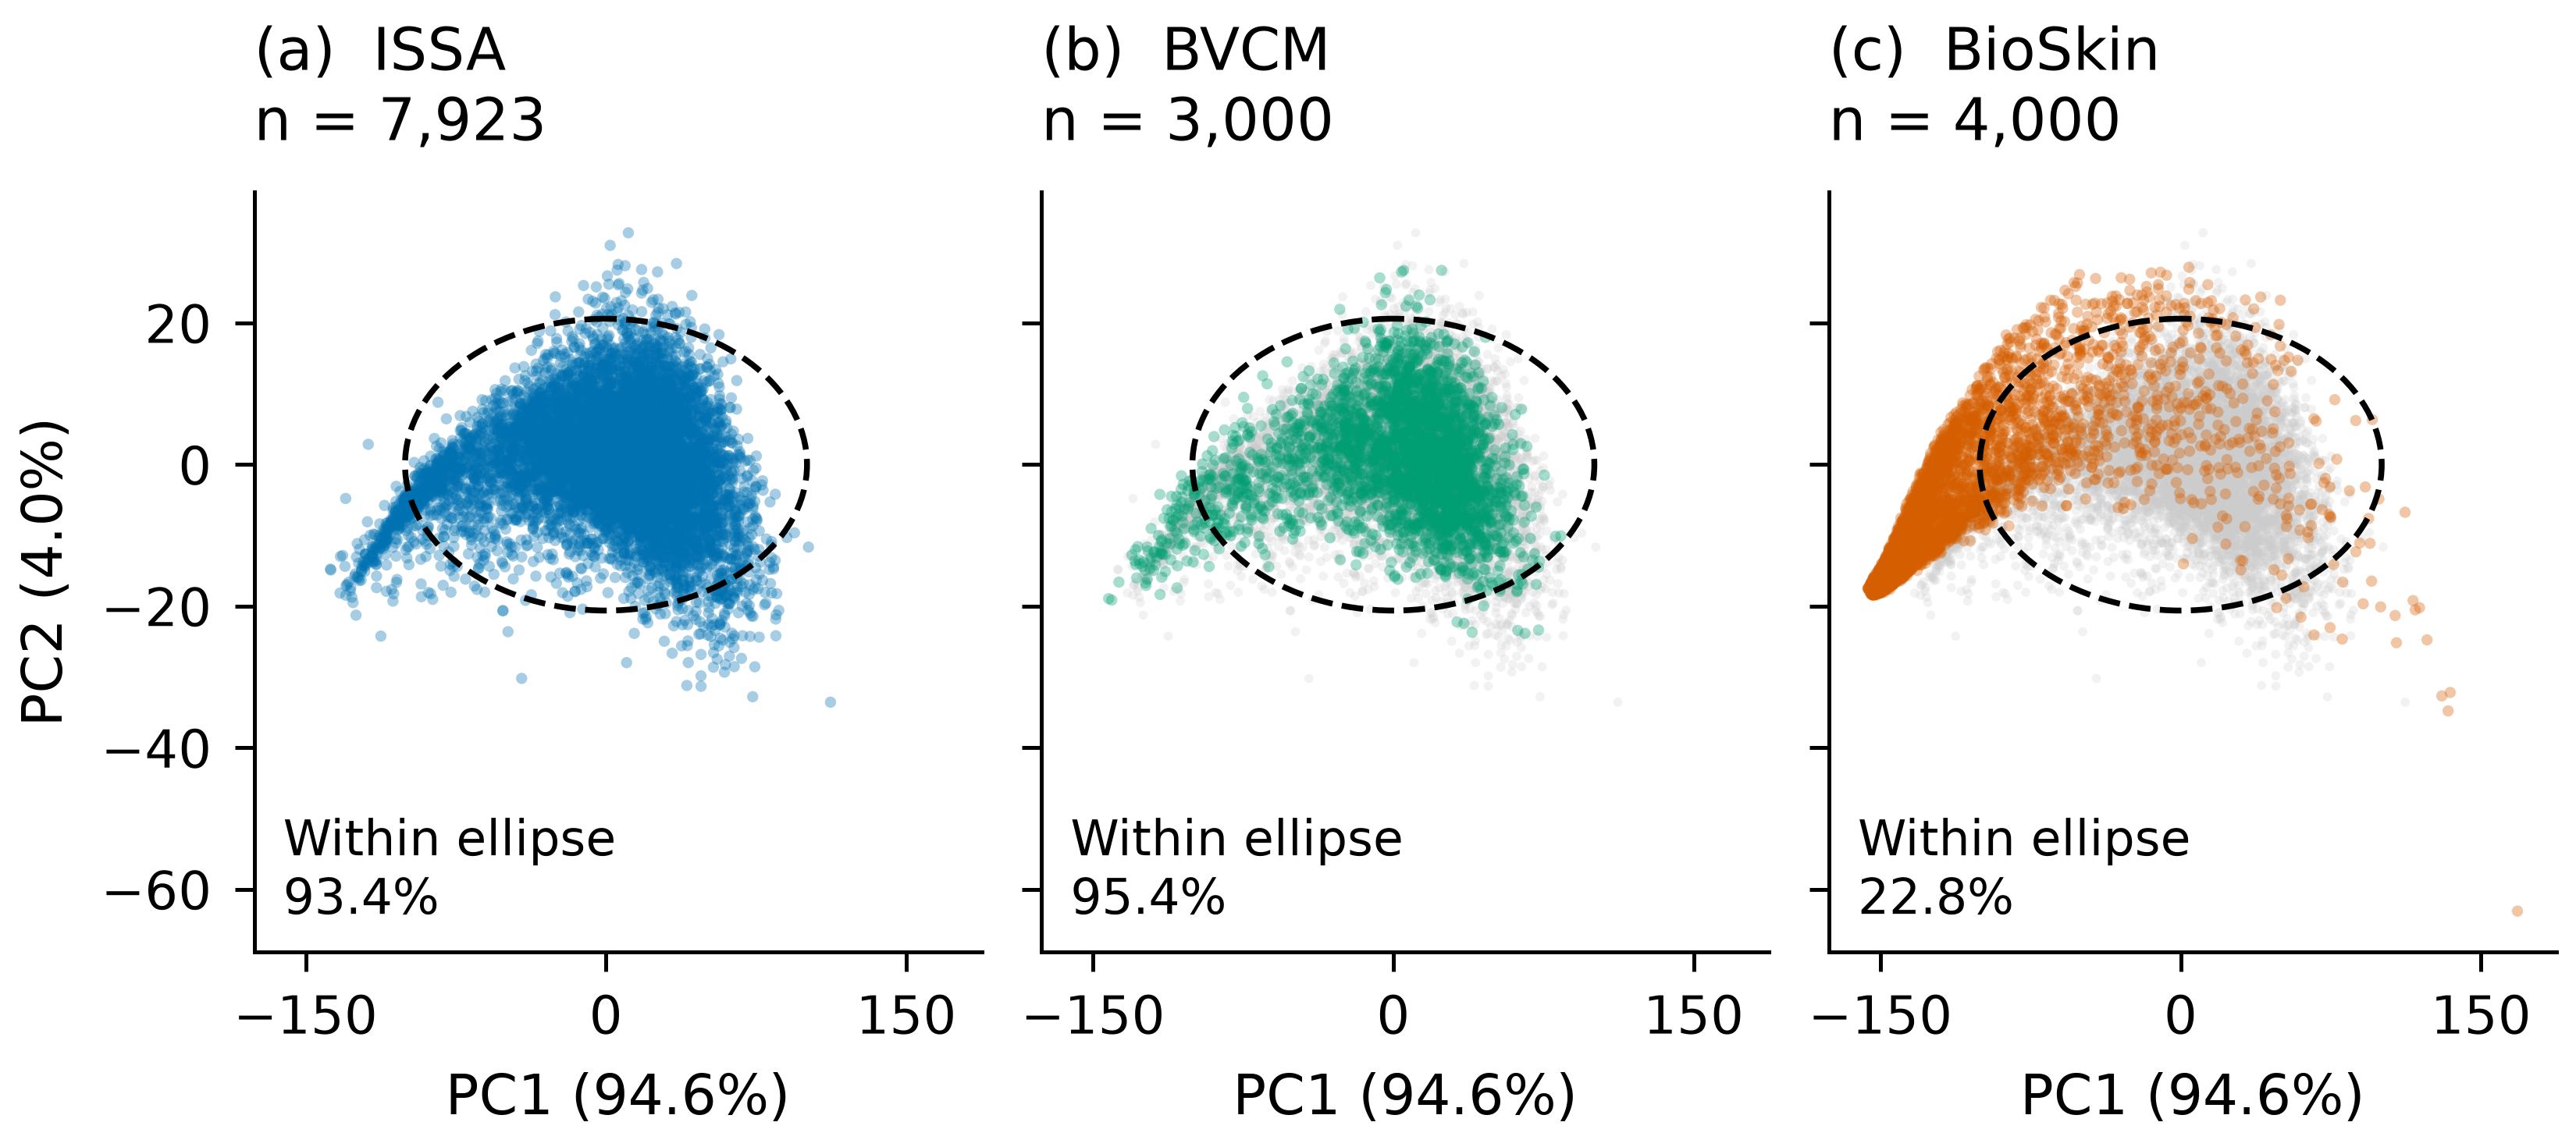
PCA is fitted to ISSA only. BioSkin spectra and BVCM population predictions are projected using the same ISSA mean and loadings. The first two components explain 98.6% of ISSA variance; 22.775% of BioSkin spectra fall within the nominal 95% Gaussian ISSA score ellipse. This comparison is descriptive and is separate from the two-stage validation decision.
4 Reproducibility
The reference uses 7,923 cleaned facial spectra, split into 6,338 training and 1,585 test records. All 41 notebook code cells completed, and independent Cholesky calculations verified the 4,000 exported decisions and distances.