<torch._C.Generator at 0x12cc77c50>Skin Reflectance Spectra Filter with Biological Parameters
1 Overview of simulated and real data
| Dataset | Sample Size | Wavelength Count | Wavelength Range | |
|---|---|---|---|---|
| 0 | Meta Spectra (Full wavelength) | 3624 | 310 | 380.0-998.0 nm |
| 1 | Meta Spectra (Used wavelength) | 3624 | 31 | 400.0-700.0 nm |
| 2 | ISSA Spectra (All sites) | 15256 | 31 | 400.0-700.0 nm |
| 3 | ISSA Spectra (Face) | 8033 | 31 | 400.0-700.0 nm |
The face sites in the ISSA dataset include site IDs 2, 3, 4, 5, 6, and 9, which correspond to cheek, cheek bone, chin, ear bone, forehead, and nose tip.
Summary Statistics for Simulated Meta Parameters:
| Parameter | Min | Max | Mean | Std | |
|---|---|---|---|---|---|
| 0 | Melanin Volume Fraction | 0.001 | 0.429 | 0.108 | 0.122 |
| 1 | Blood Volume Fraction | 0.001 | 0.200 | 0.041 | 0.053 |
| 2 | Thickness | 0.001 | 0.035 | 0.018 | 0.010 |
| 3 | Eumelanin Ratio | 0.650 | 0.800 | 0.725 | 0.043 |
| 4 | Oxygenated Hemoglobin Ratio | 0.900 | 1.000 | 0.950 | 0.029 |
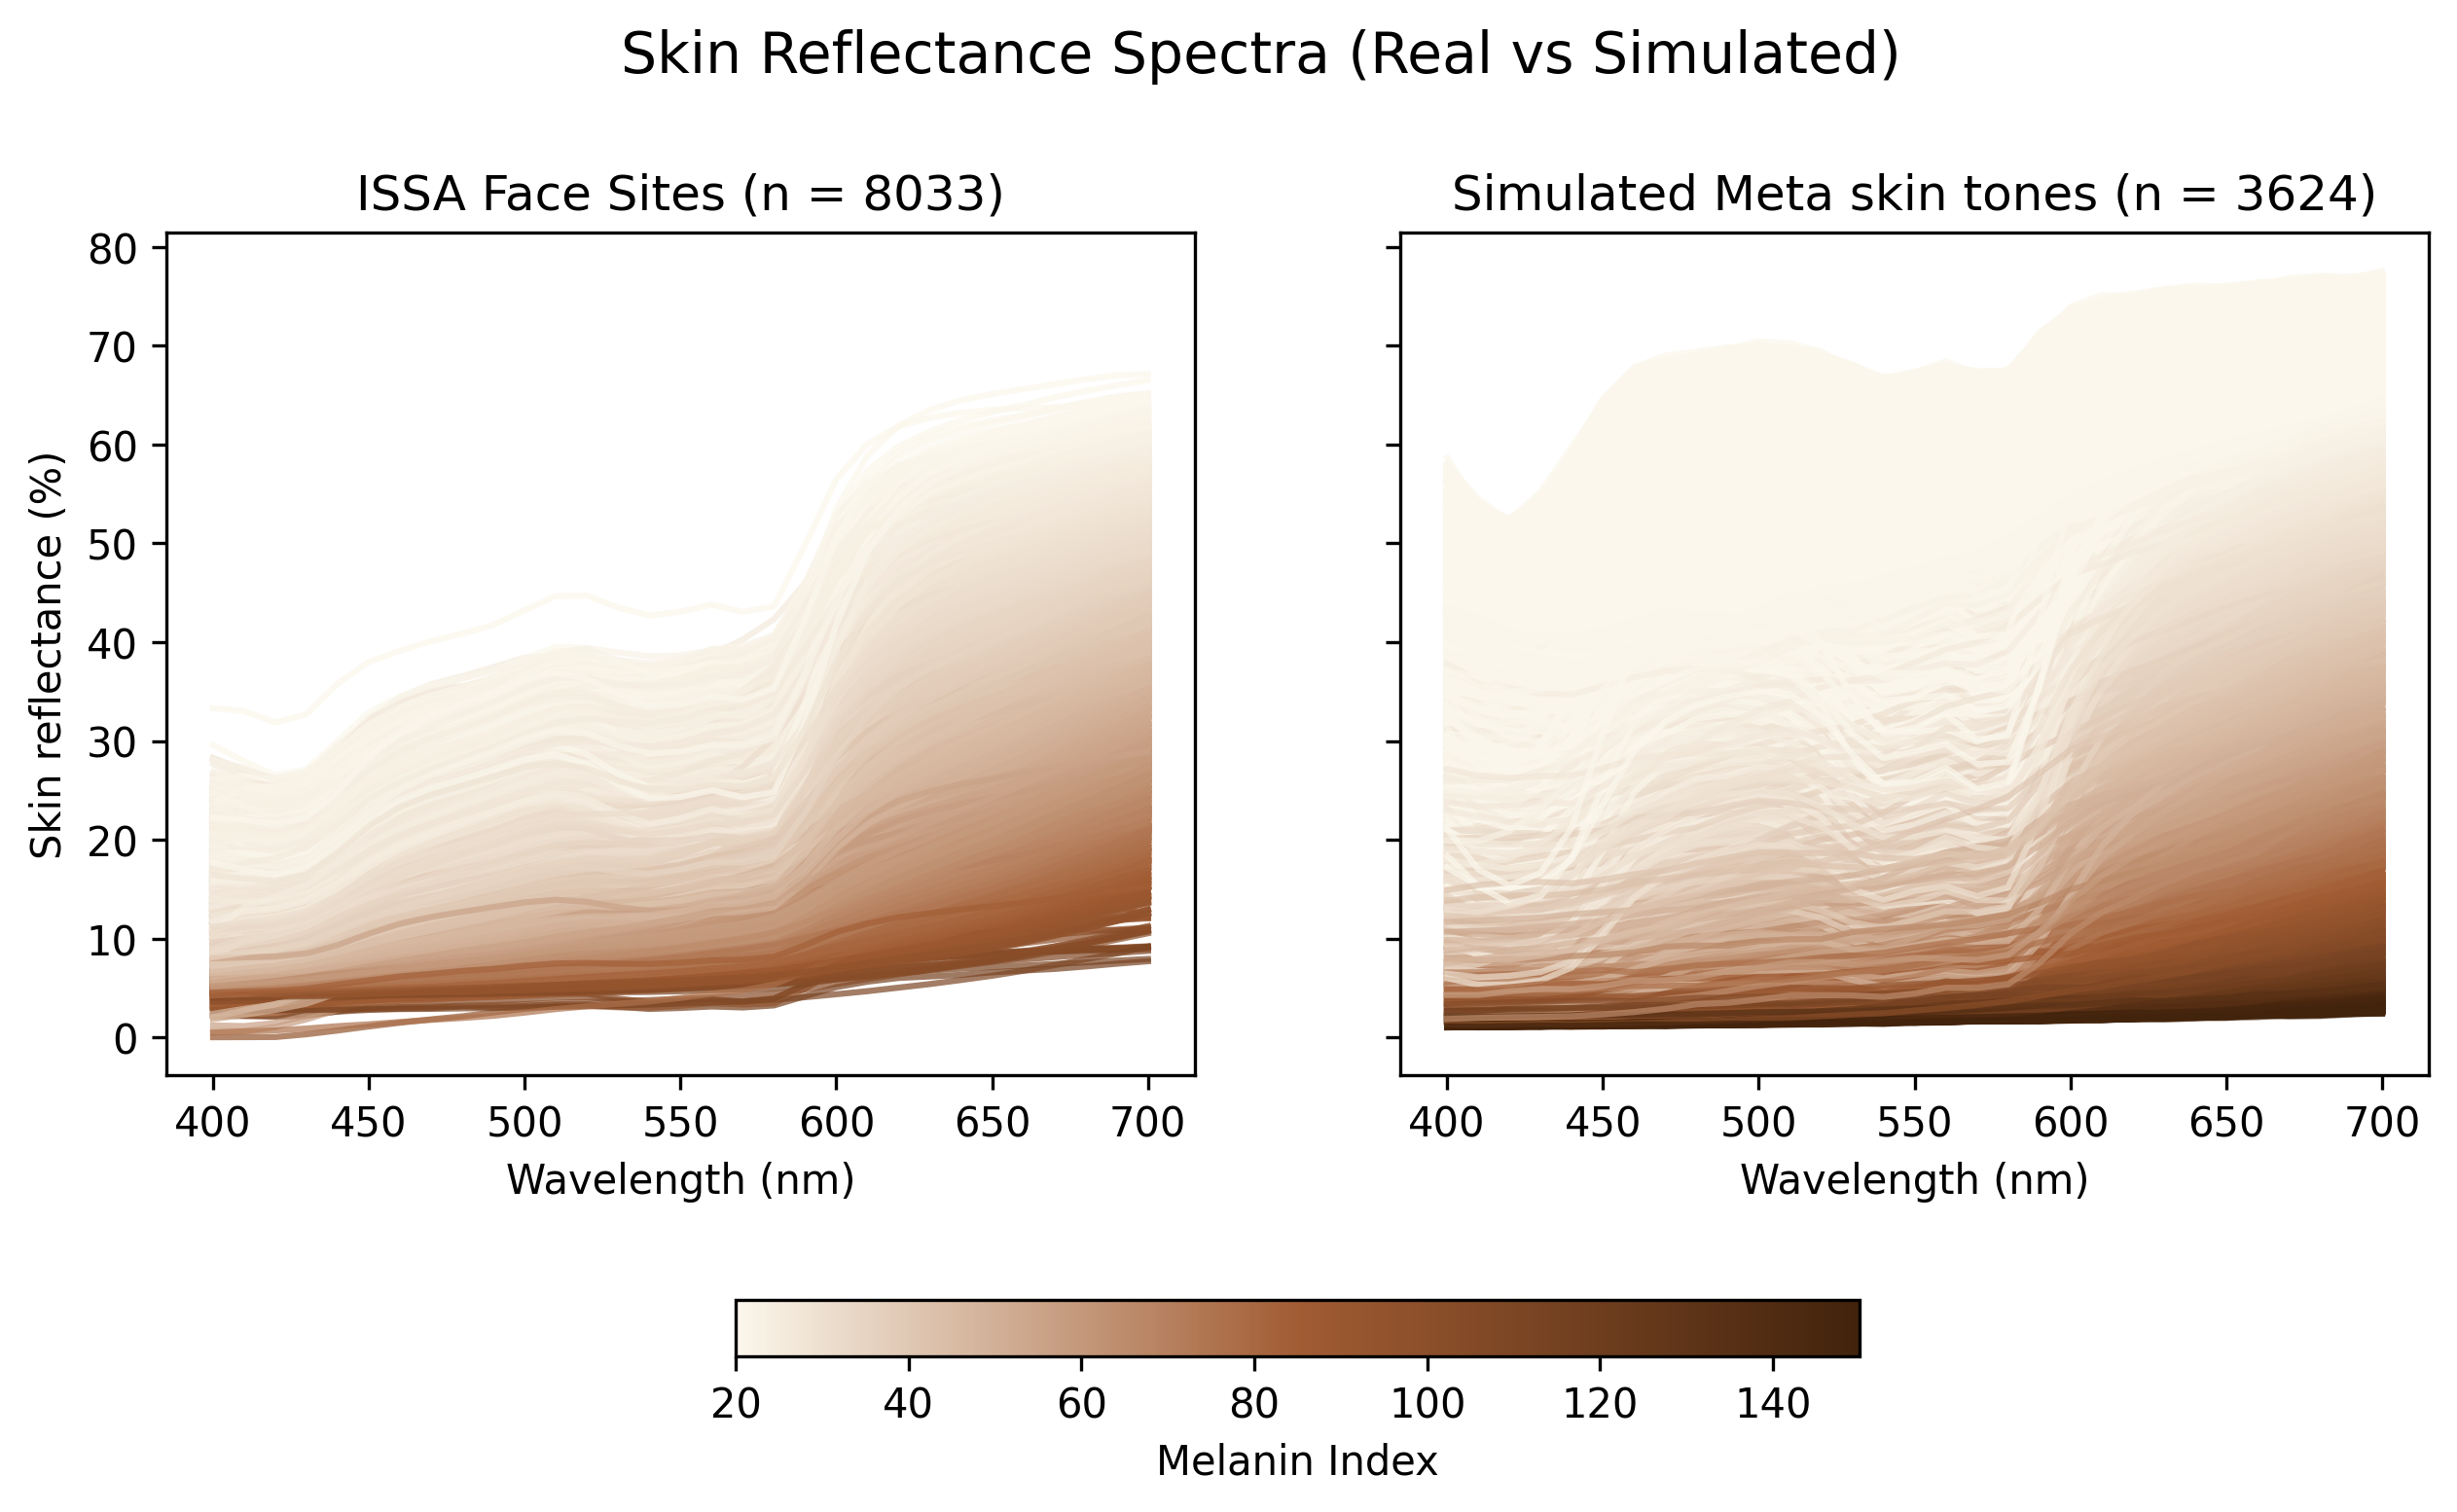
Let us examine the ISSA face skin reflectance spectra, and the Meta simulated skin reflectance spectra.
2 Filter the simulated skin reflectance spectra based on the ISSA dataset
We establish two interpretable rules to determine whether a simulated skin reflectance curve is realistic. They are based on the skin reflectance spectra from the ISSA dataset. The two rules are:
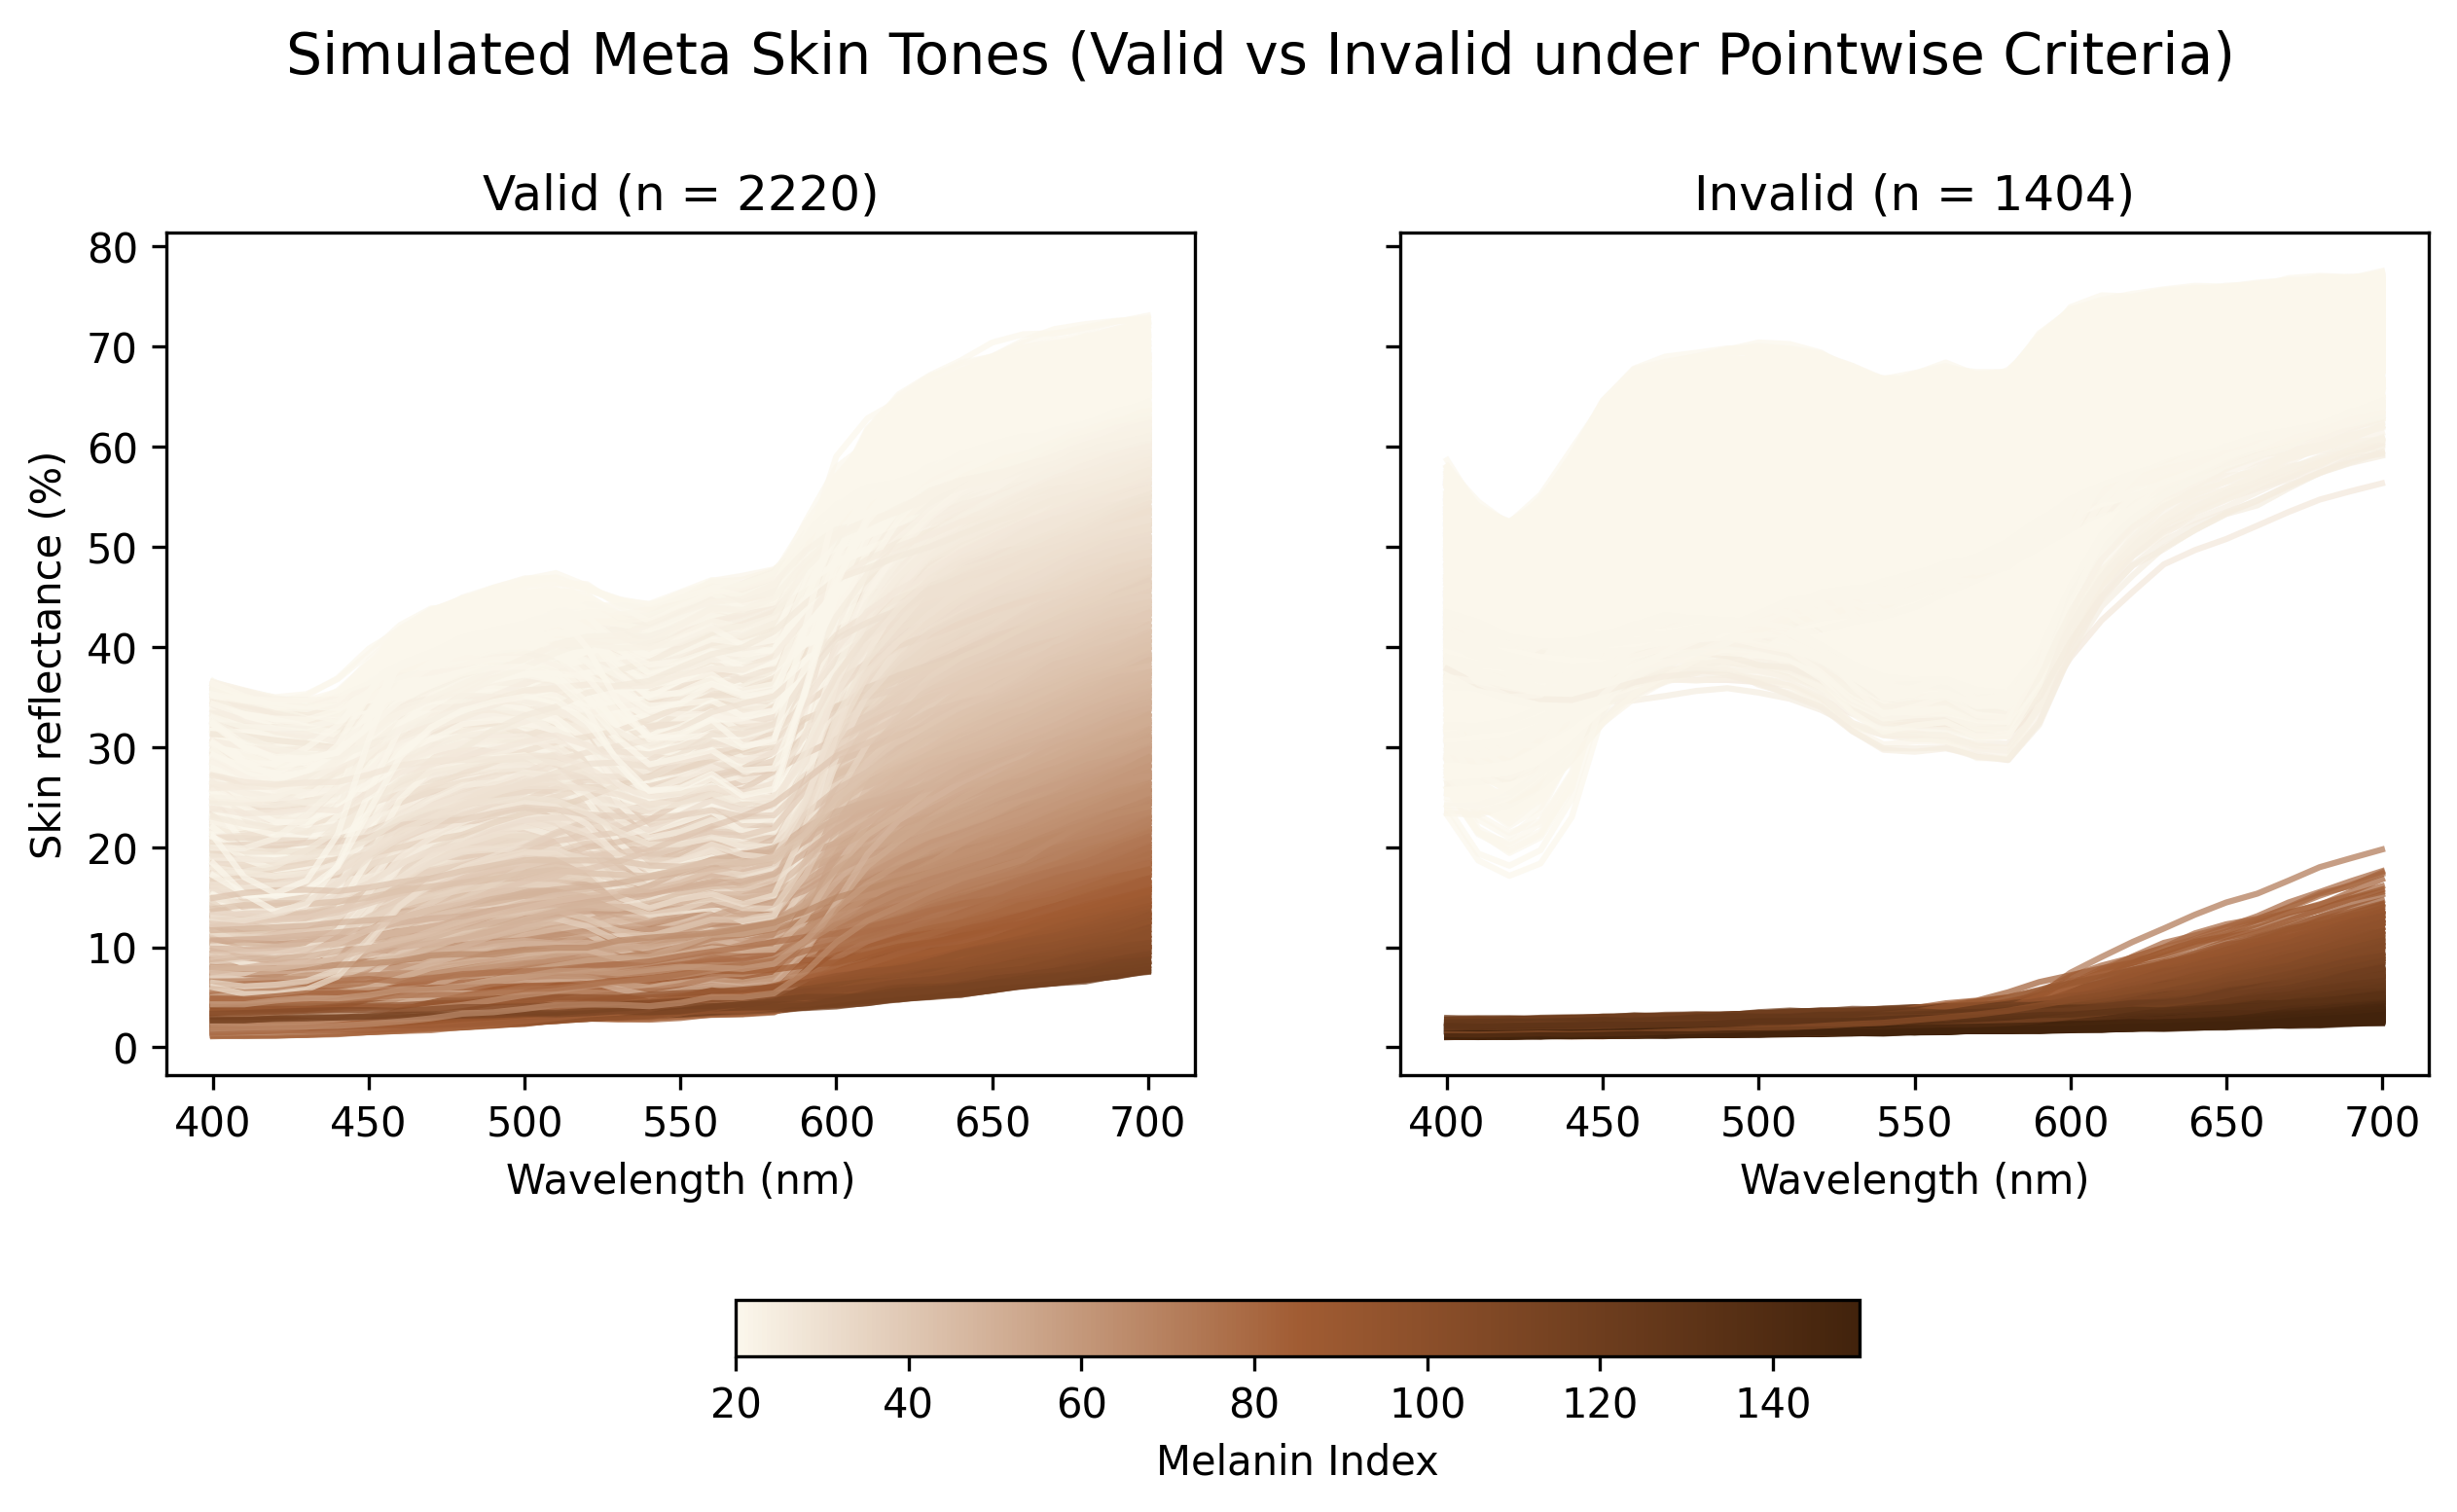
- Pointwise reflectance values should lie within the \(0.9\min\) and \(1.1\max\) values observed in the ISSA dataset at each wavelength. We relax the bounds by 10% to account for some variability.
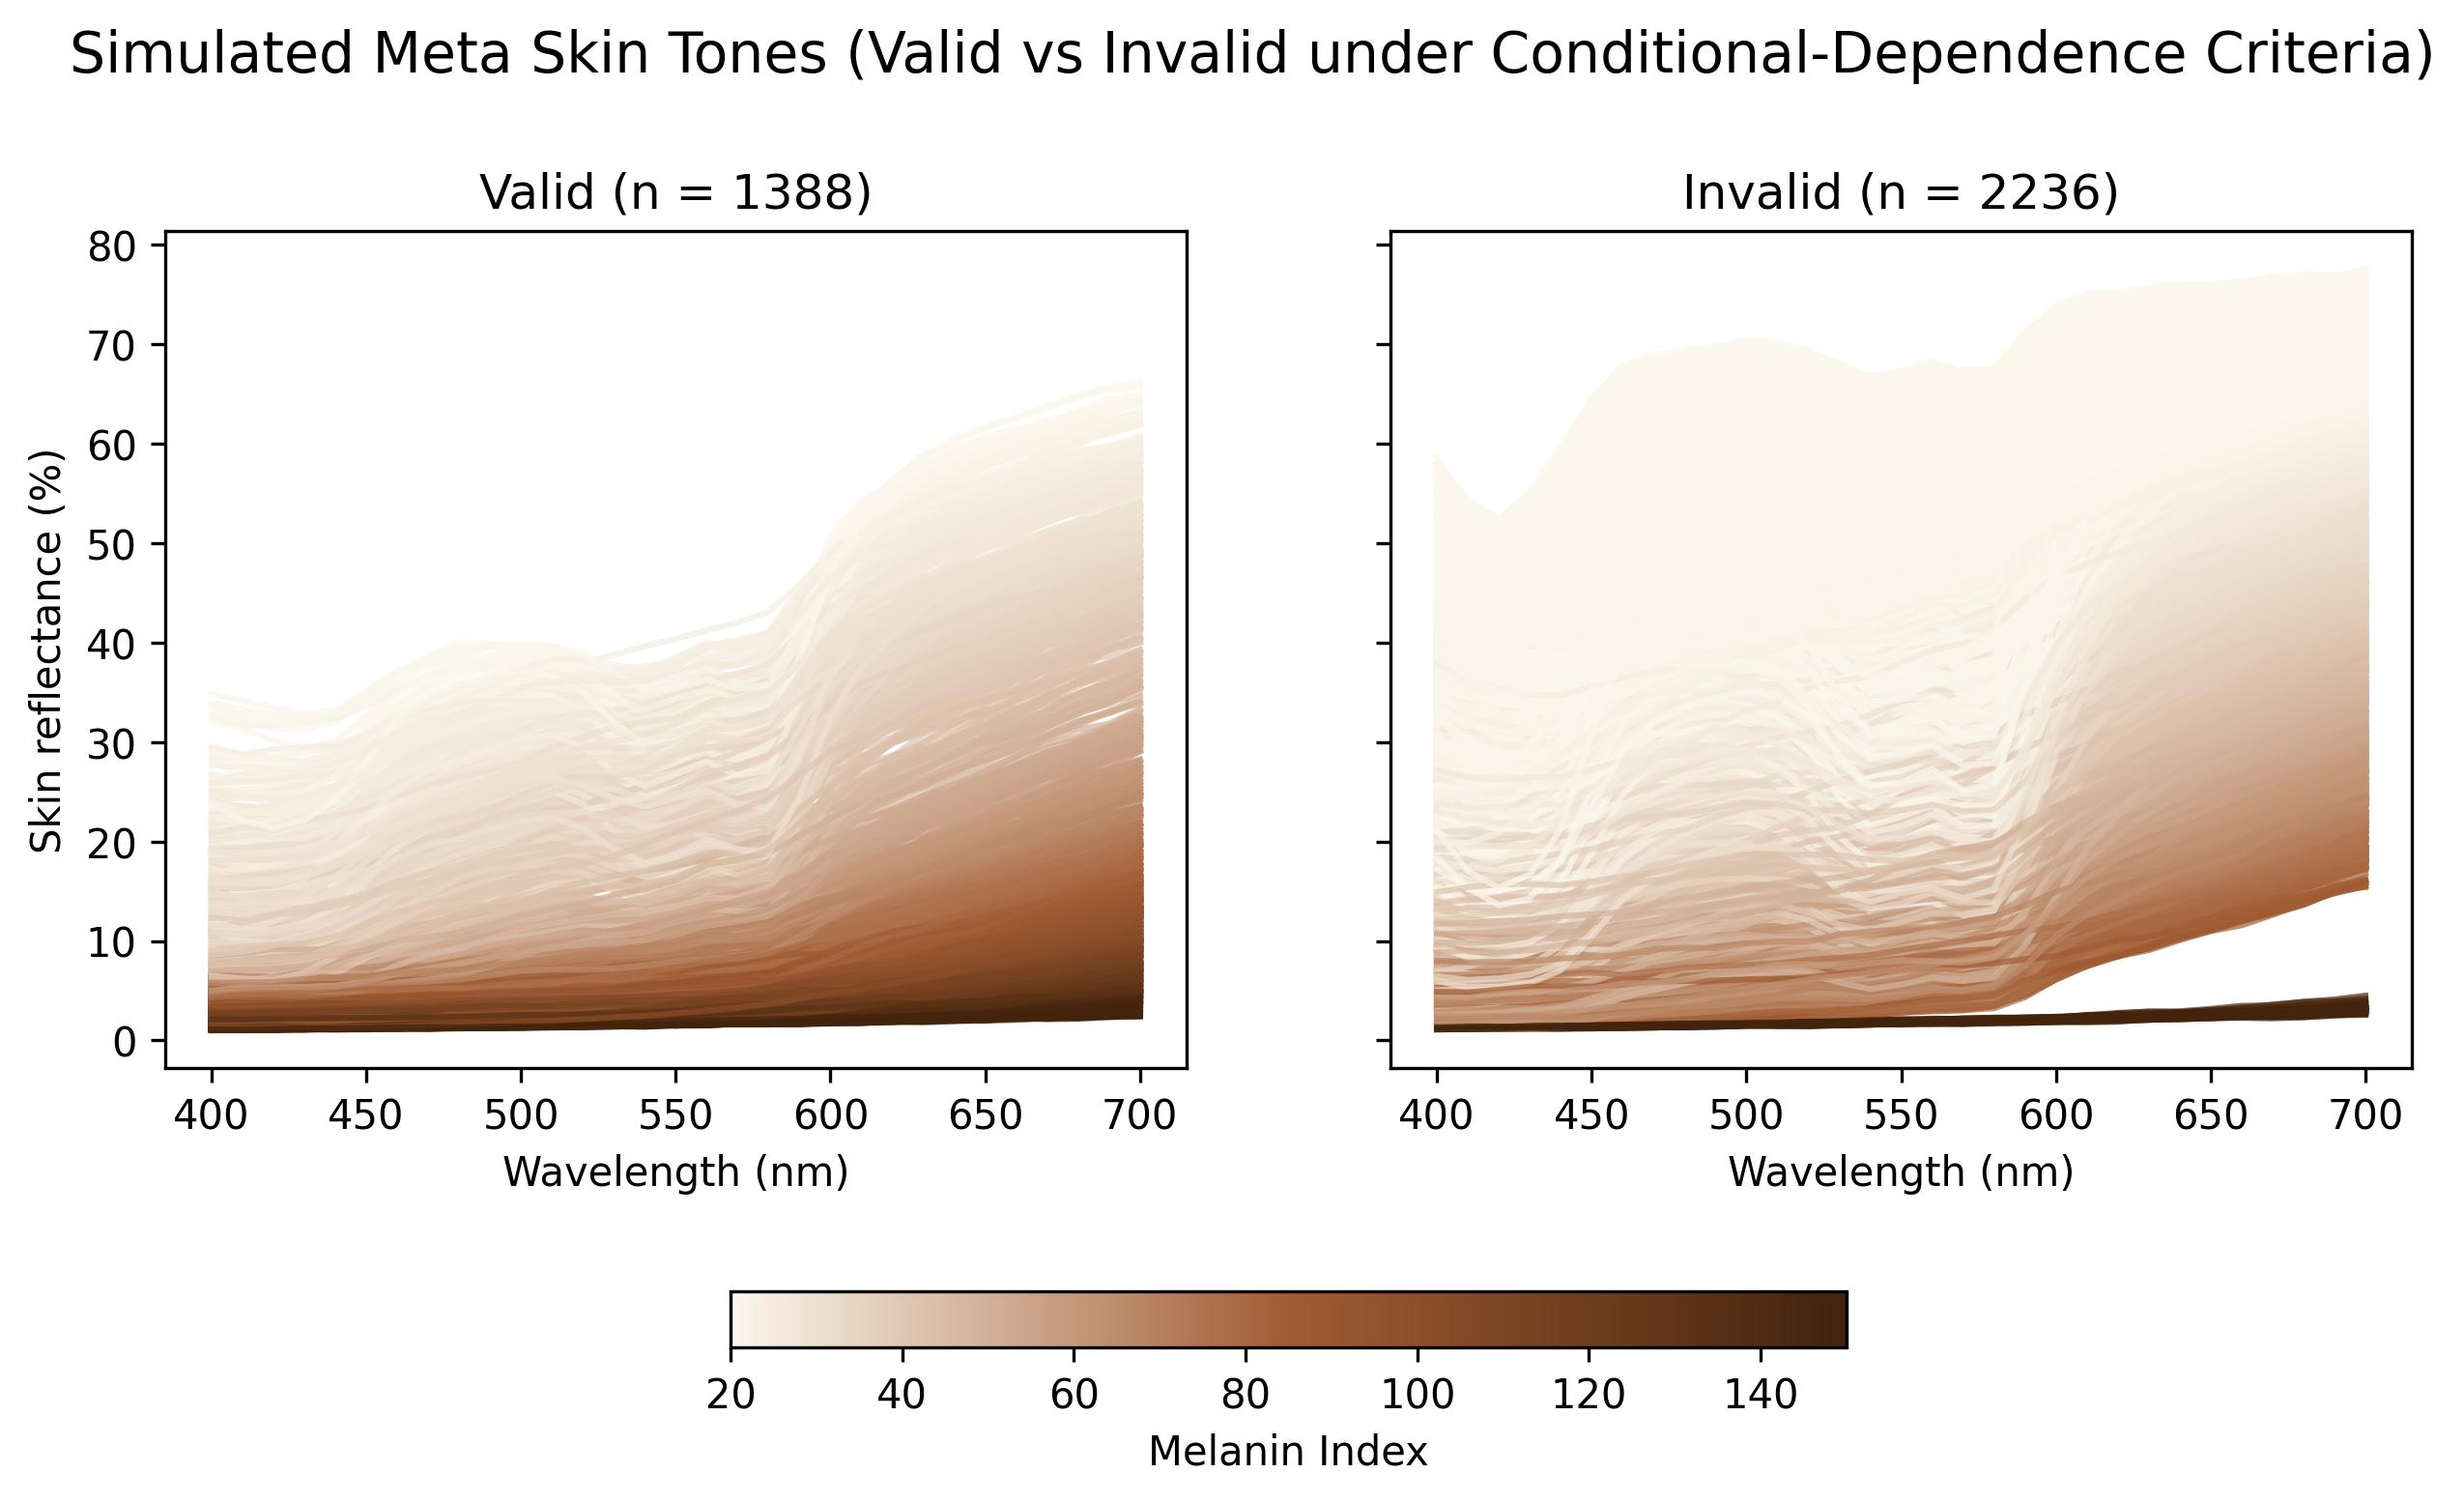
- Conditional dependence between wavelengths should be the same pattern as that observed in the ISSA dataset.
2.1 Pointwise criteria
2.2 Conditional dependencies
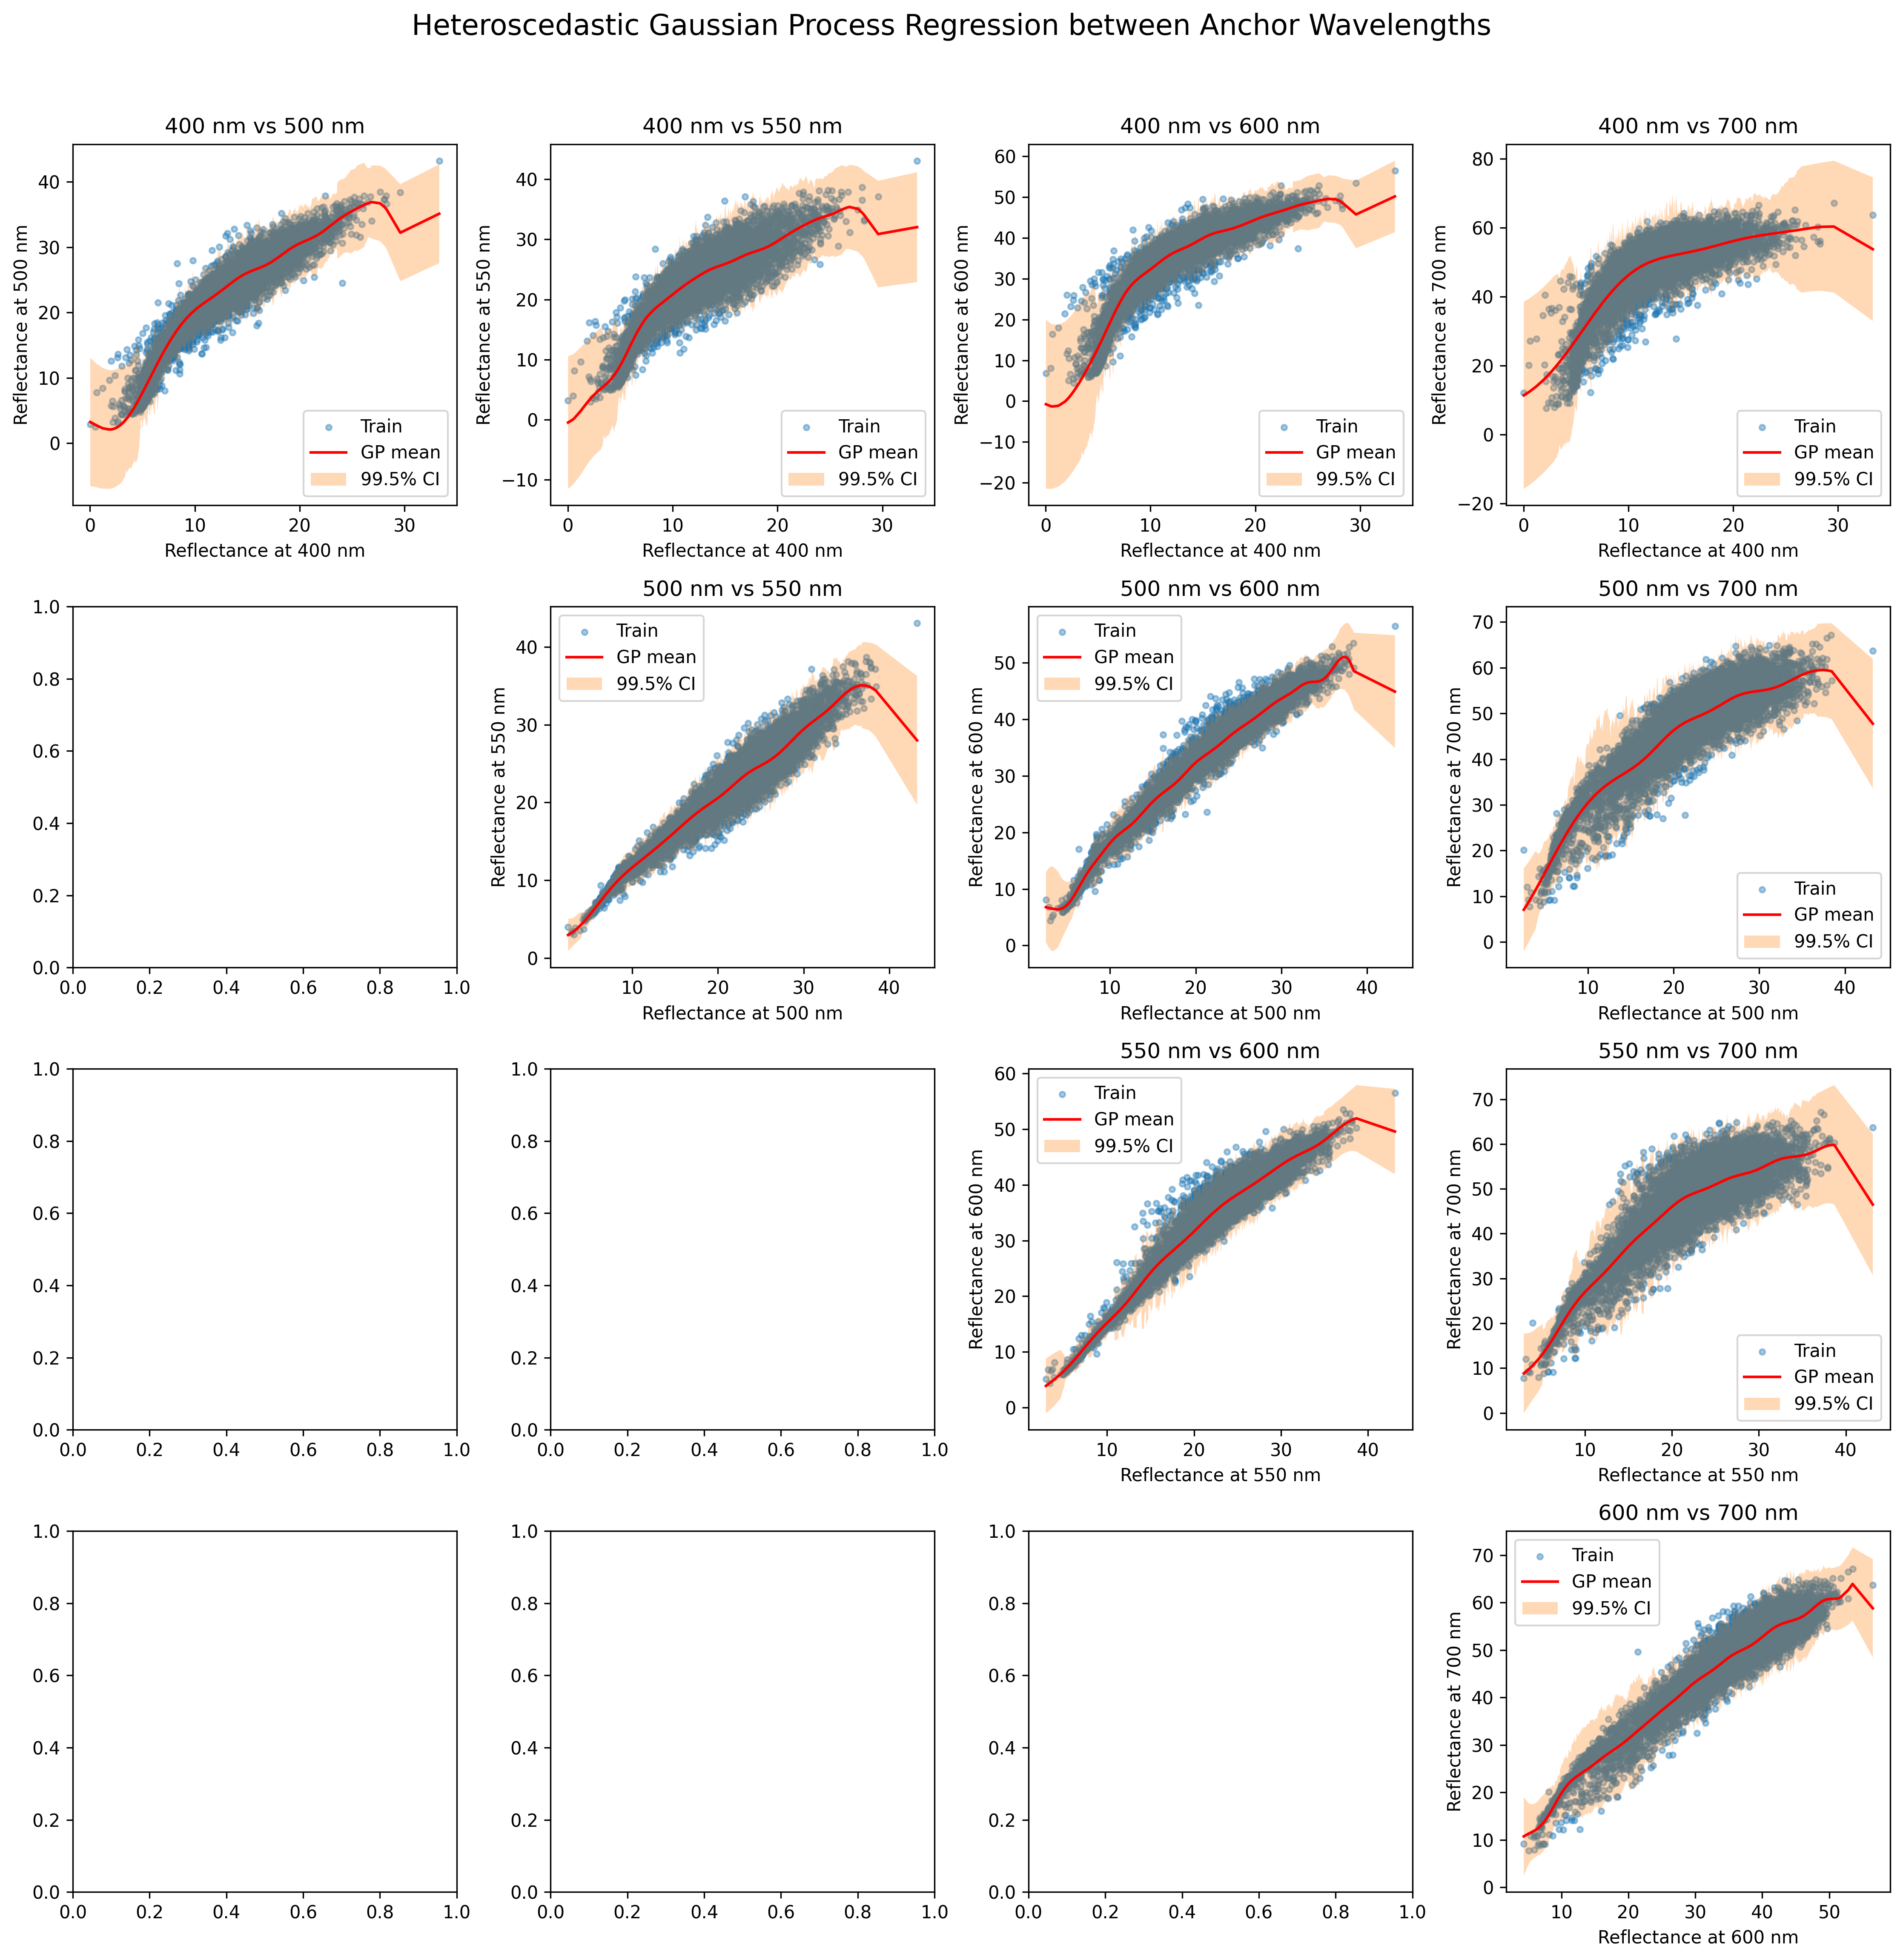
Pick several anchor wavelengths. Here the anchor wavelengths are \([400, 500, 550, 600, 700]\) (nm).
For any pair of anchor wavelengths \(w_1<w_2\), run Gaussian process regression between skin reflectance at \(w_1\) and \(w_2\) of ISSA face sites.
Given a simulated skin spectra and a pair of anchor wavelengths \(w_1<w_2\), predict the \(99.5\%\) credible interval of skin reflectance at \(w_2\) conditional on the simulated skin reflectance at \(w_1\). Check whether the simulated skin reflectance at \(w_2\) lies inside the \(99.5\%\) credible interval.
Filter out the simulated skin spectra if its reflectance at some \(w_2\) lies outside the corresponding \(99.5\%\) credible interval. According to Bonferroni inequality, the false positive rate is under \(5\%\).
2.3 Combine two criteria
Now we combine both filtering criteria to identify simulated skin spectra that are realistic according to both rules:
- Pointwise criteria: Reflectance values at each wavelength must lie within \([0.9\min, 1.1\max]\) of ISSA face measurements
- Conditional dependence criteria: Reflectance values at anchor wavelength pairs must satisfy the conditional relationships learned from ISSA data (within 99.5% credible intervals)
A sample is classified as valid only if it passes both criteria. This combined approach ensures that: - Individual wavelength values are plausible (pointwise) - The relationships between wavelengths follow realistic patterns (conditional dependence)
Samples failing either criterion are classified as invalid and filtered out from the final dataset.
Classification Summary:
============================================================
Total samples: 3624

Pointwise criteria only:
  Valid: 2220 (61.26%)
  Invalid: 1404 (38.74%)

Conditional dependence criteria only:
  Valid: 1388 (38.30%)
  Invalid: 2236 (61.70%)

Combined criteria (both must pass):
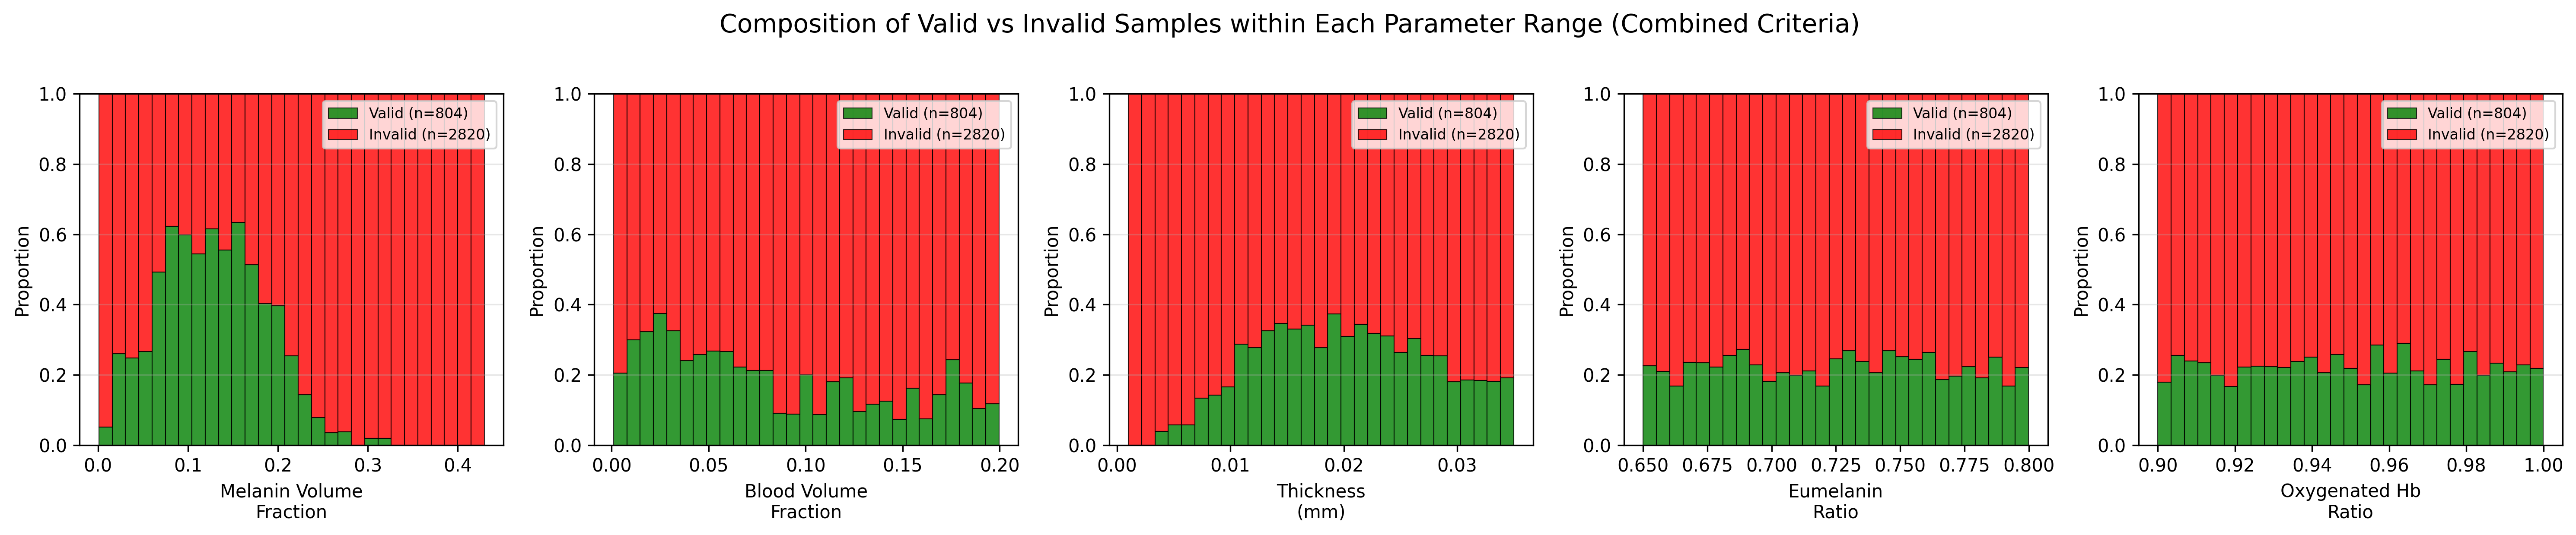
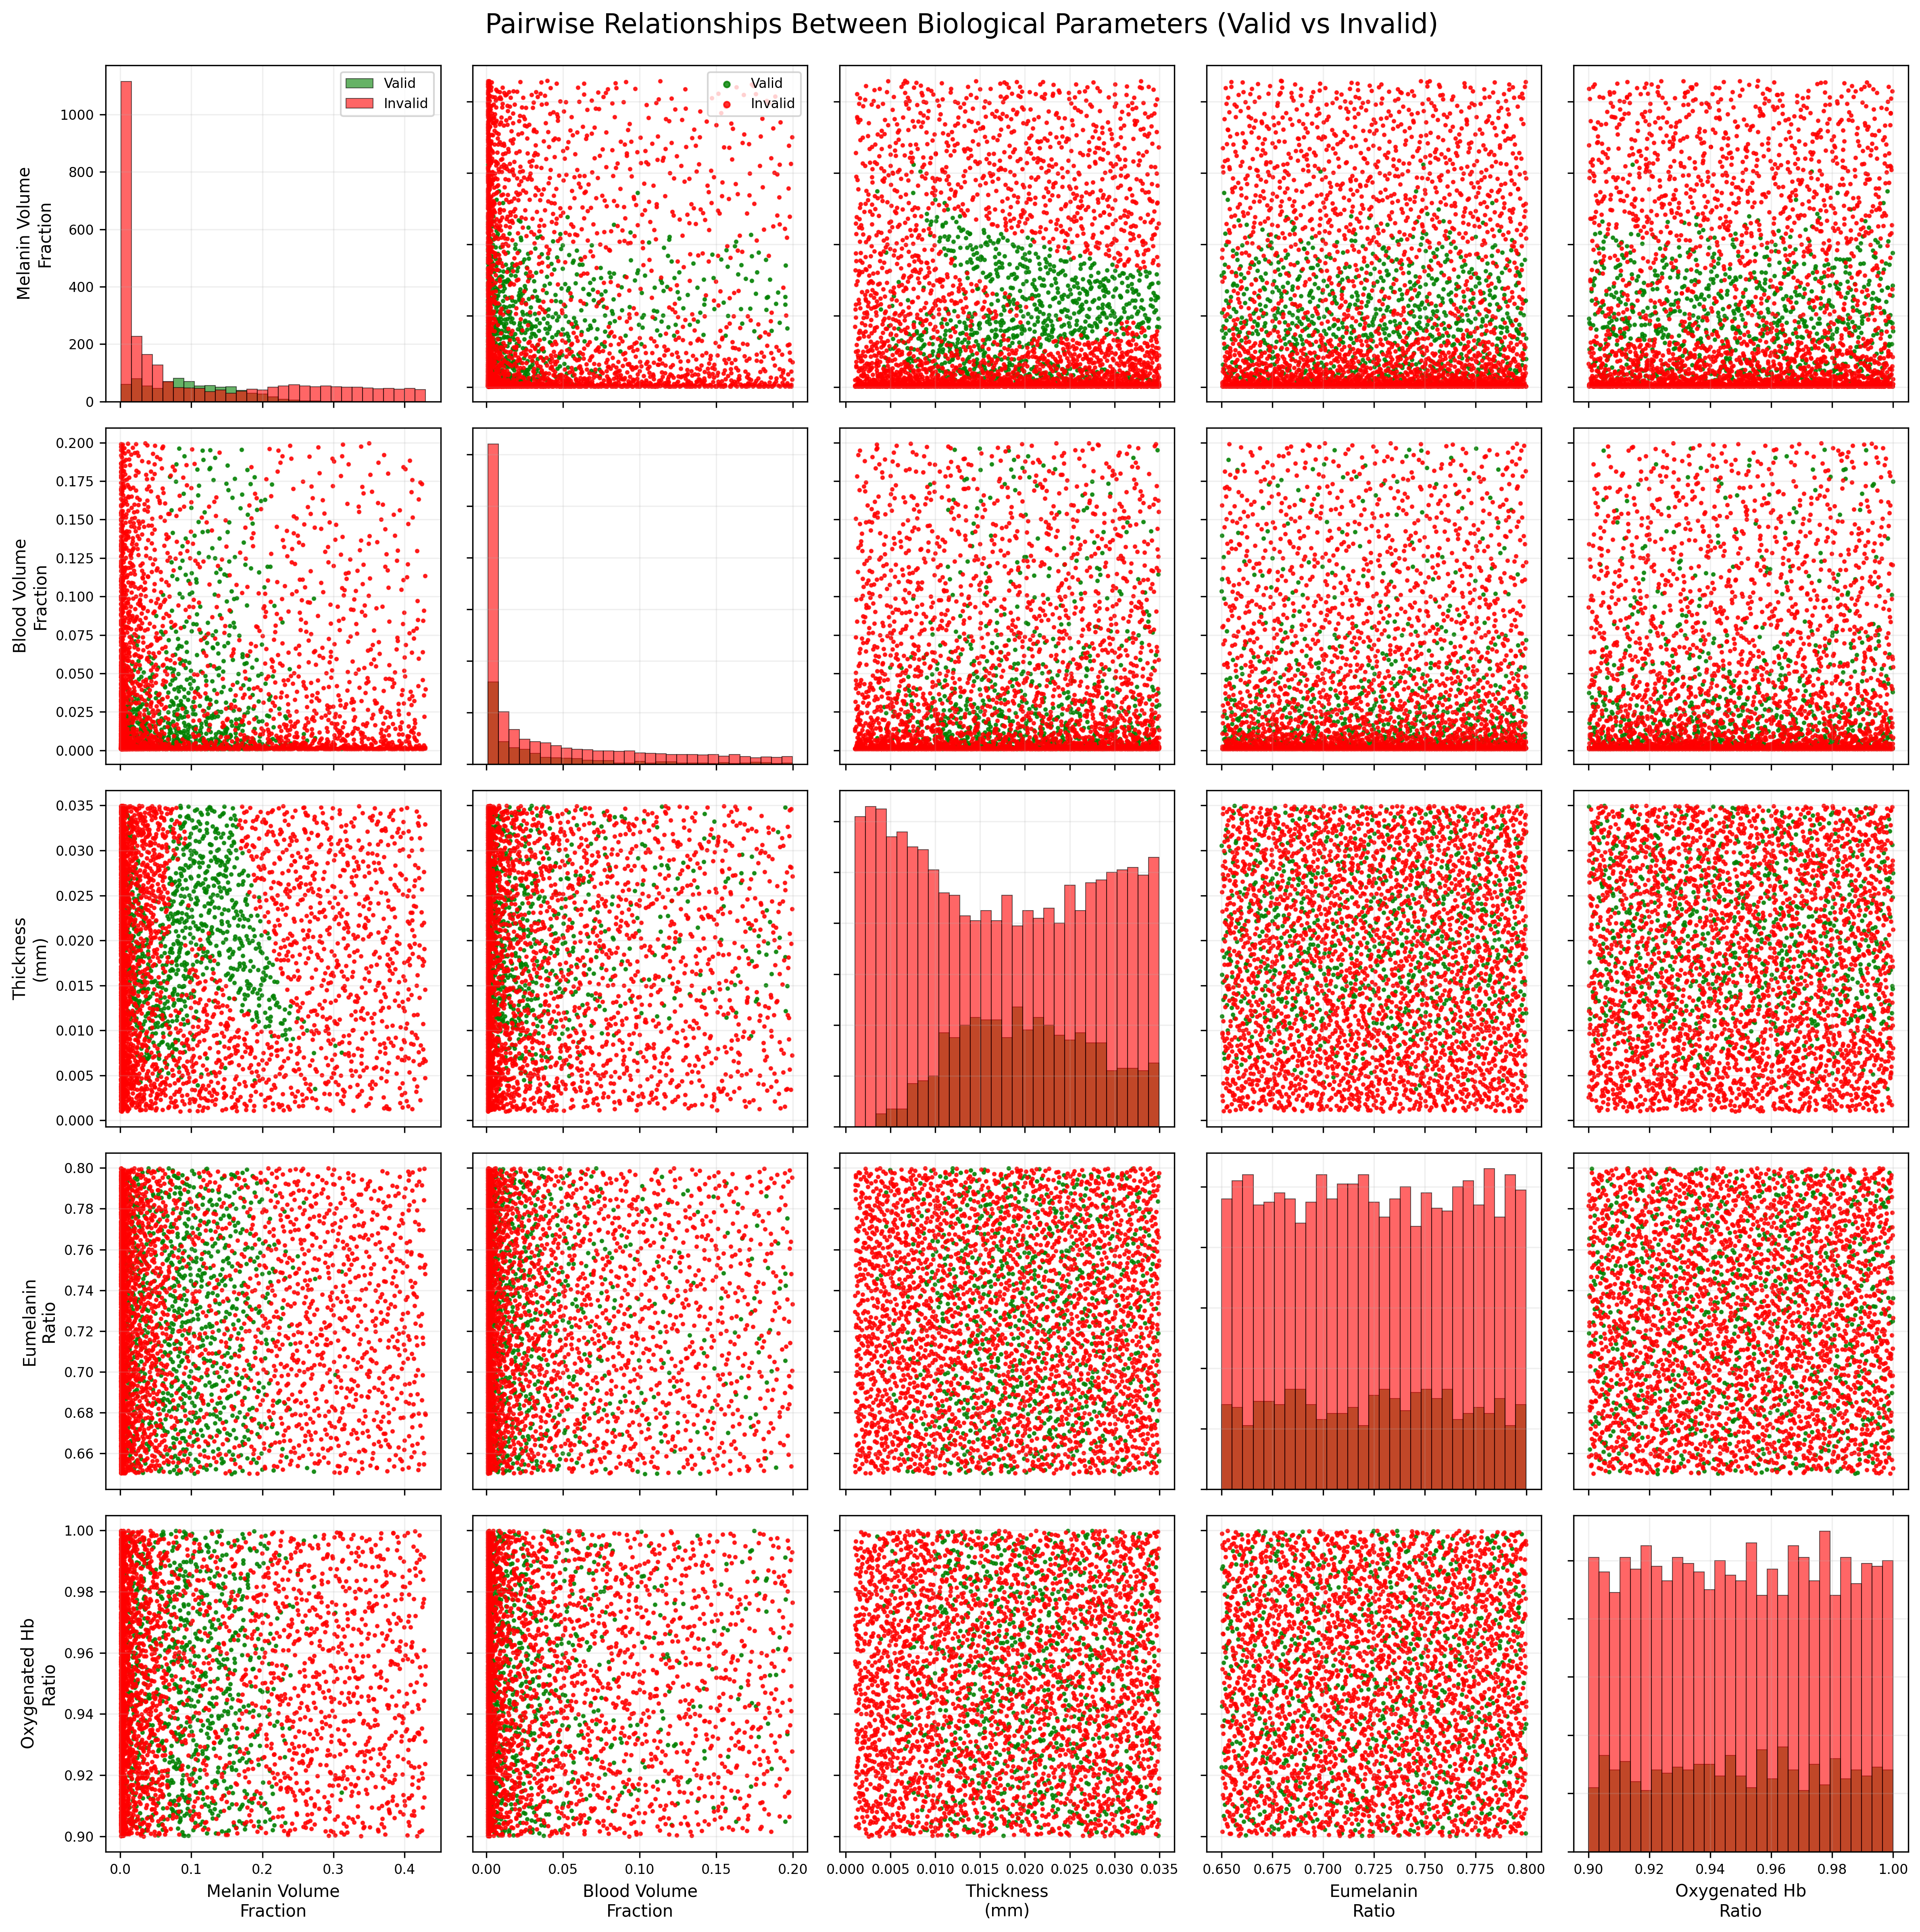
  Valid: 804 (22.19%)
  Invalid: 2820 (77.81%)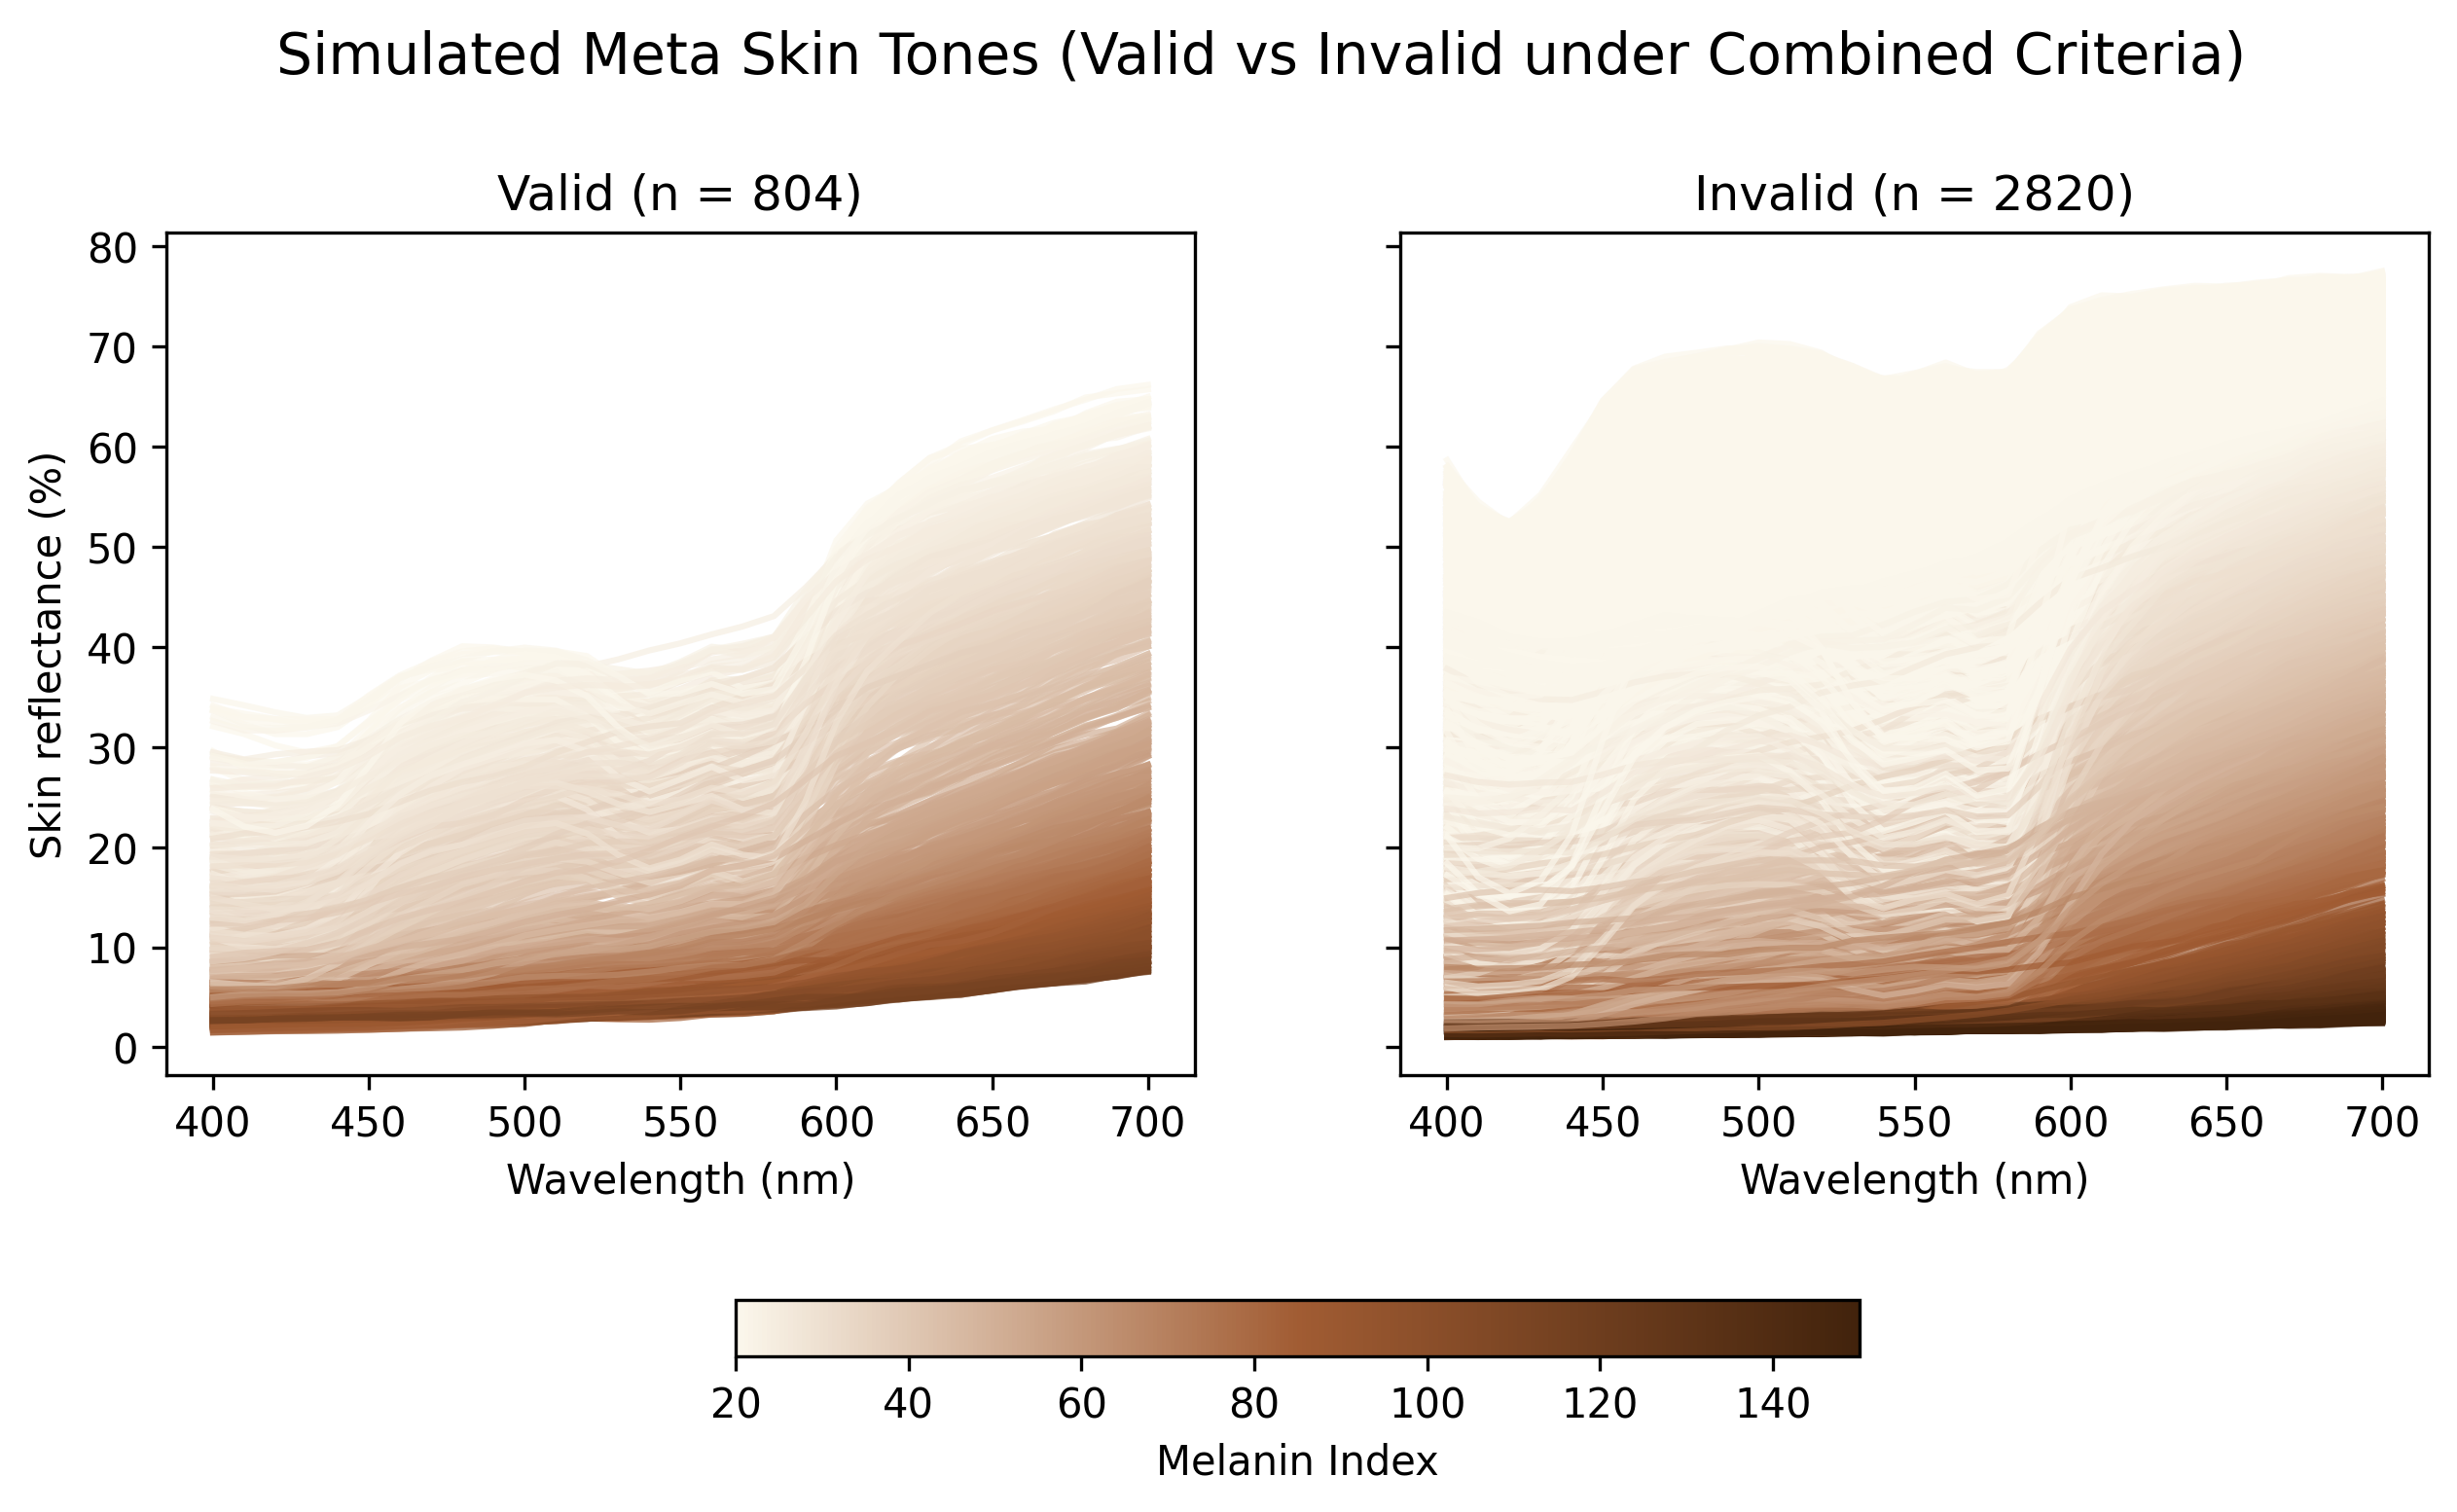
Parameter Ranges for Invalid Samples under Combined Criteria:
| Parameter | Min | Max | Mean | Std | |
|---|---|---|---|---|---|
| 0 | Melanin Volume Fraction | 0.001 | 0.429 | 0.111 | 0.134 |
| 1 | Blood Volume Fraction | 0.001 | 0.200 | 0.043 | 0.055 |
| 2 | Thickness | 0.001 | 0.035 | 0.017 | 0.010 |
| 3 | Eumelanin Ratio | 0.650 | 0.800 | 0.725 | 0.043 |
| 4 | Oxygenated Hemoglobin Ratio | 0.900 | 1.000 | 0.950 | 0.029 |
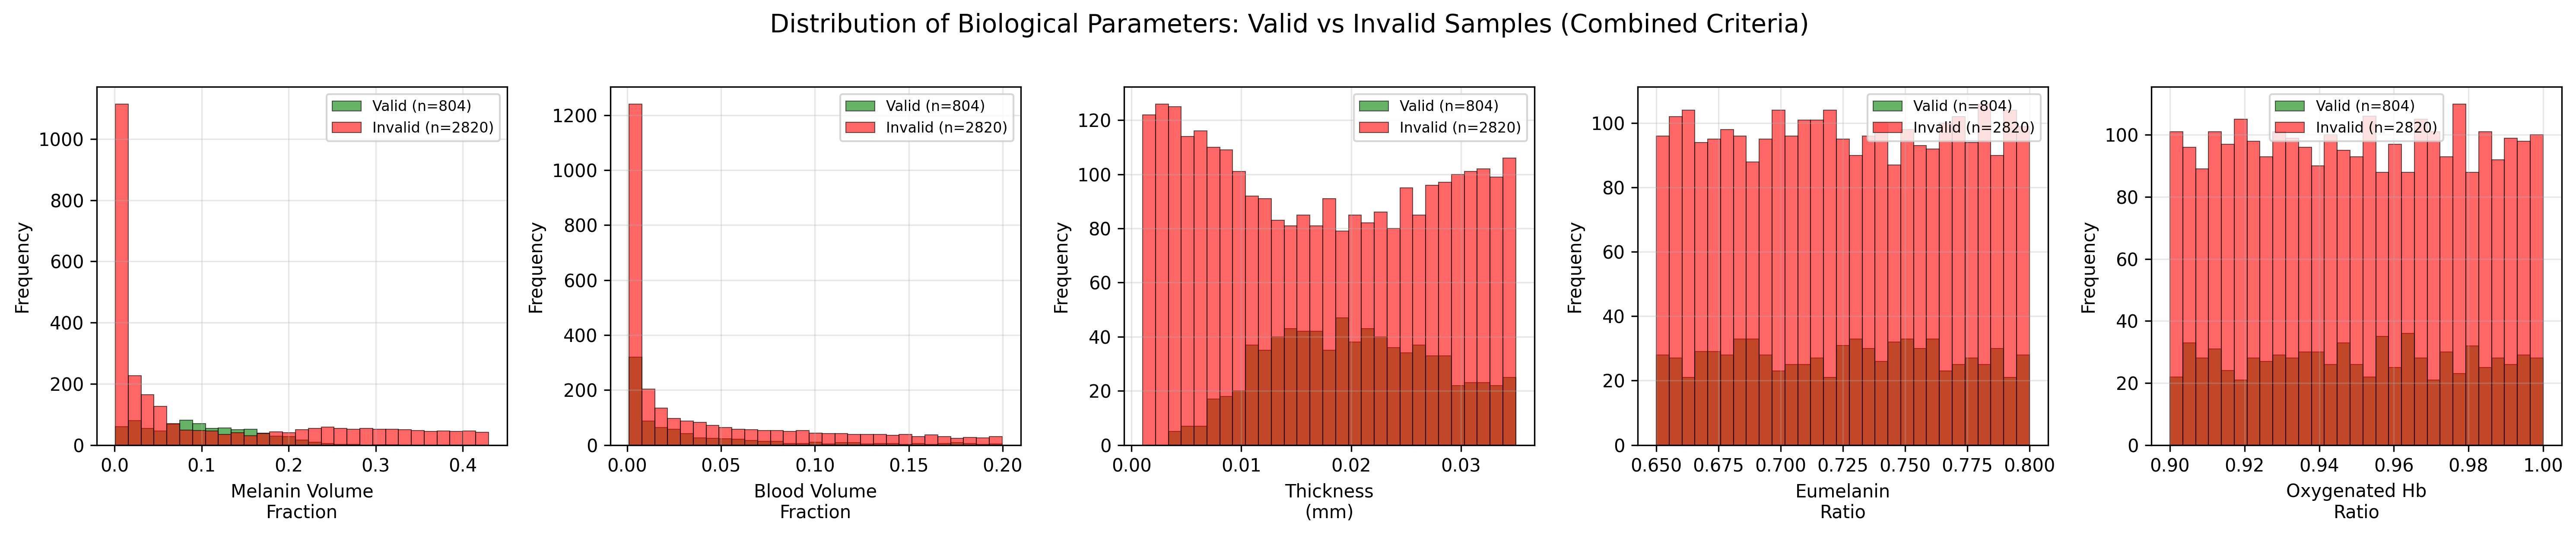
3 Examine biological parameters of filtered simulated spectra
4 PCA of skin reflectance spectra
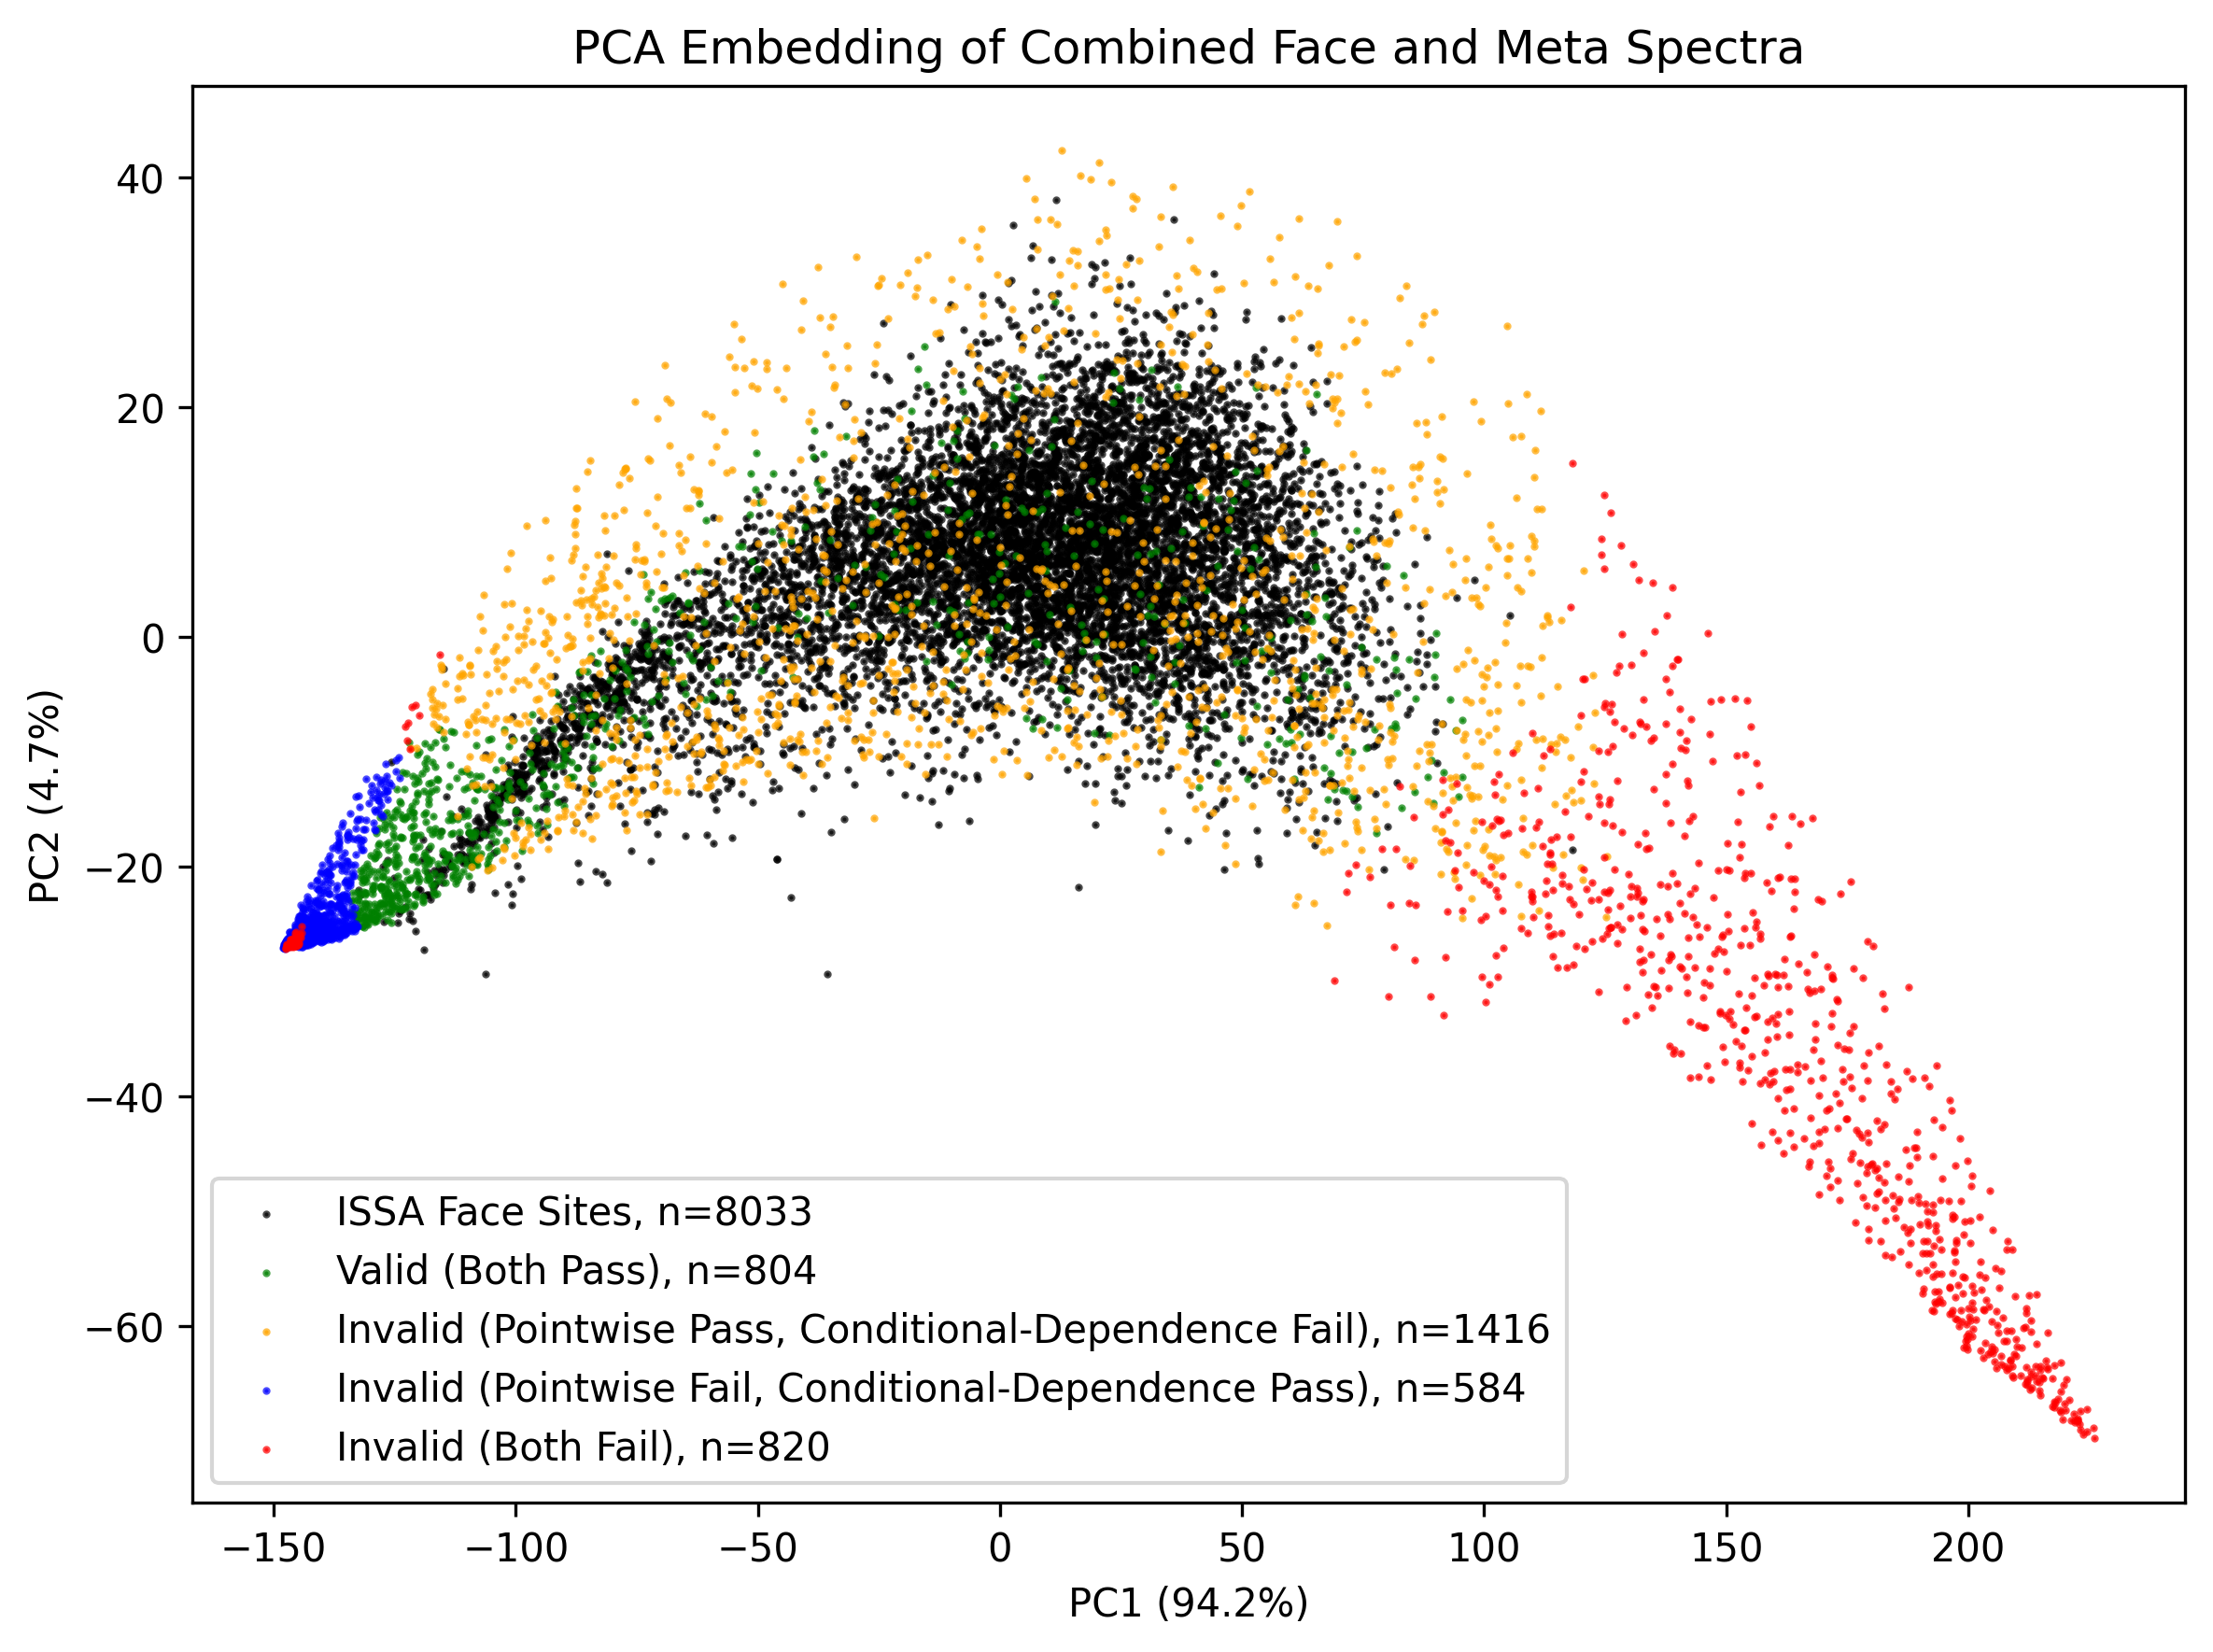
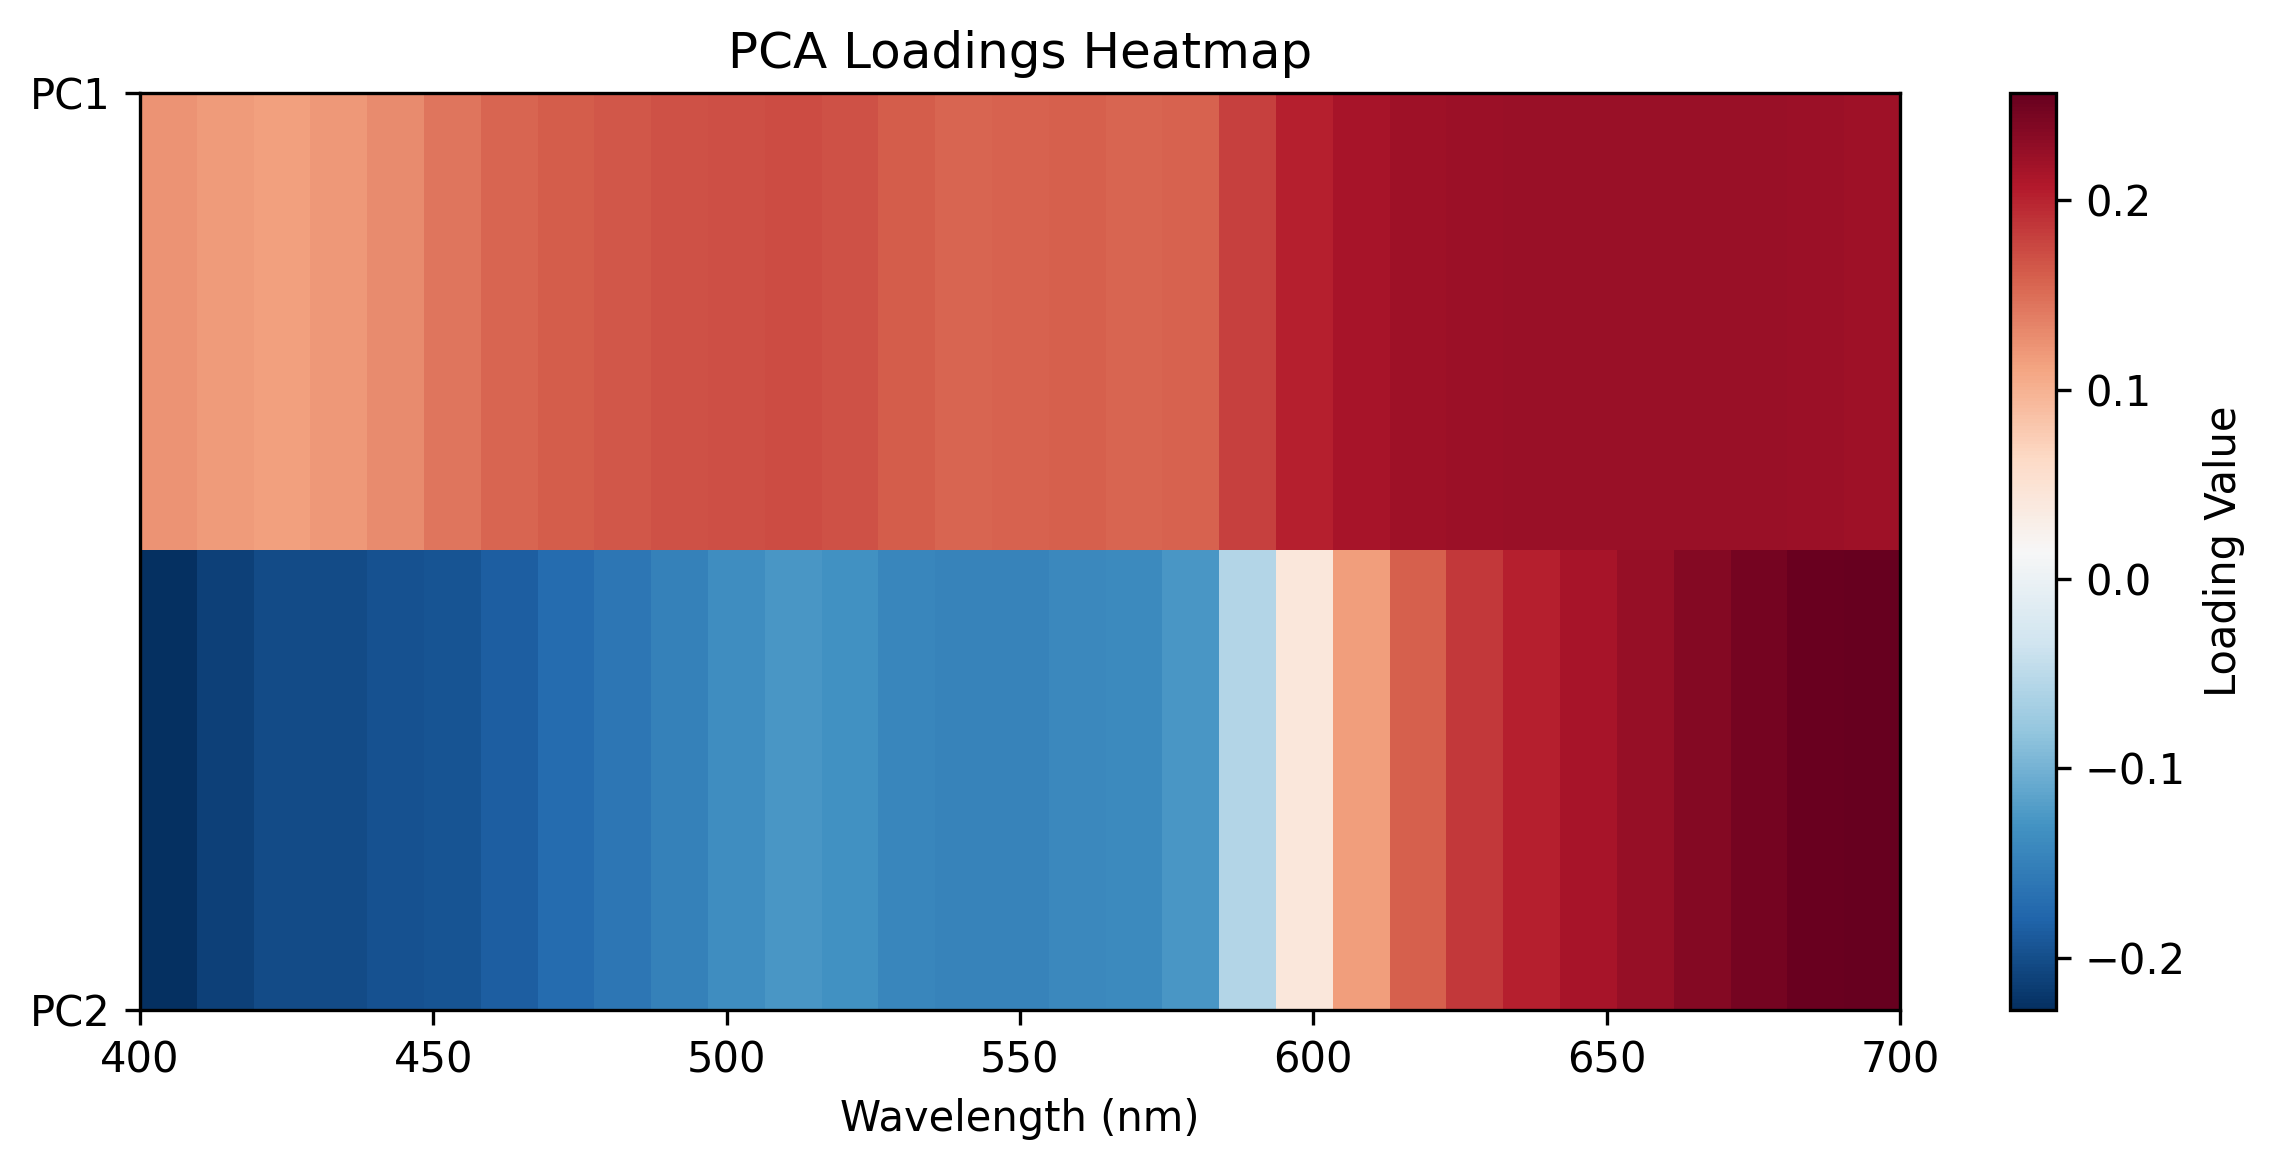
We perform PCA on the combined ISSA skin reflectance spectra and the simulated skin reflectance spectra to visualize their distributions in the principal component space. We also show the loading vectors to understand which wavelengths contribute most to the variance captured by each principal component.