| Eumelanin Class | EML (<25) | EMIL (25-49) | EMI (50-74) | EMIH (75-99) | EMH (>=100) |
|---|---|---|---|---|---|
| Site | |||||
| Cheek | 216 | 1978 | 227 | 50 | 4 |
| Cheek Bone | 24 | 186 | 18 | 0 | 0 |
| Chin | 271 | 1507 | 211 | 36 | 5 |
| Ear lobe | 9 | 394 | 57 | 12 | 3 |
| Forehead | 77 | 1772 | 190 | 30 | 3 |
| Nose tip | 29 | 582 | 31 | 1 | 0 |
| Palm | 123 | 618 | 27 | 1 | 0 |
| Total | 749 | 7037 | 761 | 130 | 15 |
Shape Analysis of Skin Reflectance Spectra
1 Overview of ISSA face and palm sites
ISSA Face and Palm Sites Eumelanin Class Summary Table:
2 Derivative-based Shape Analysis
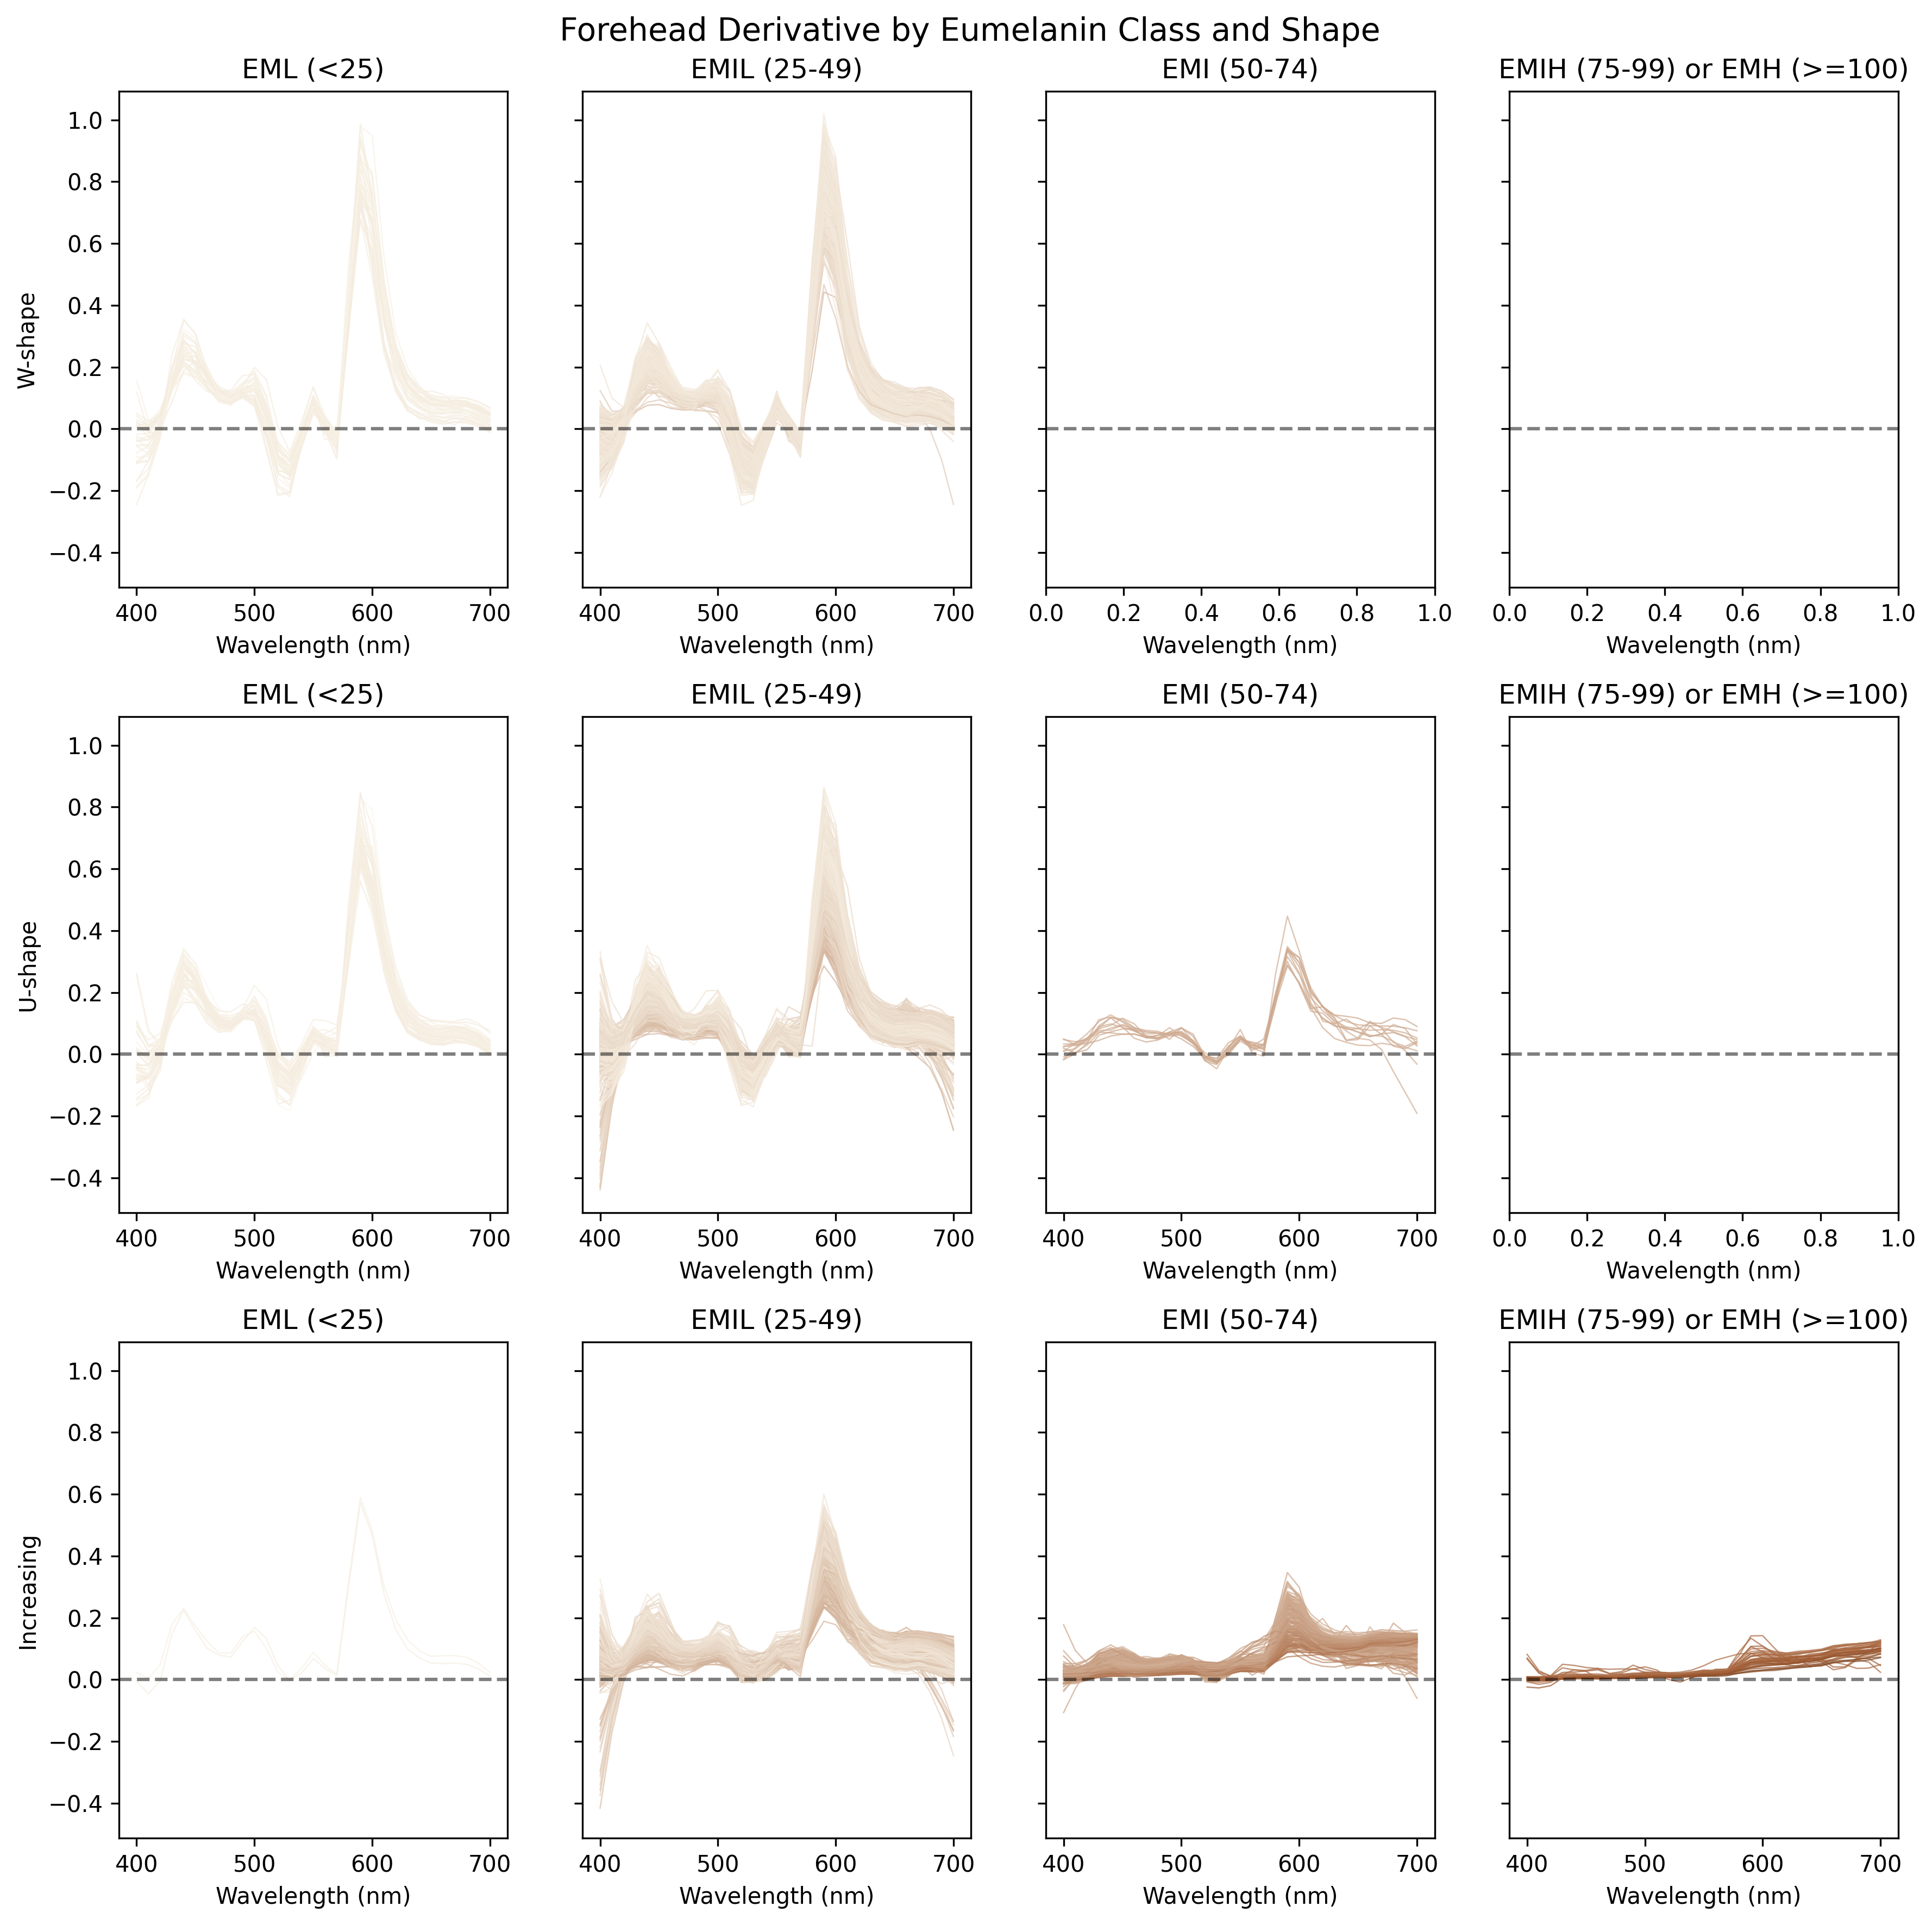
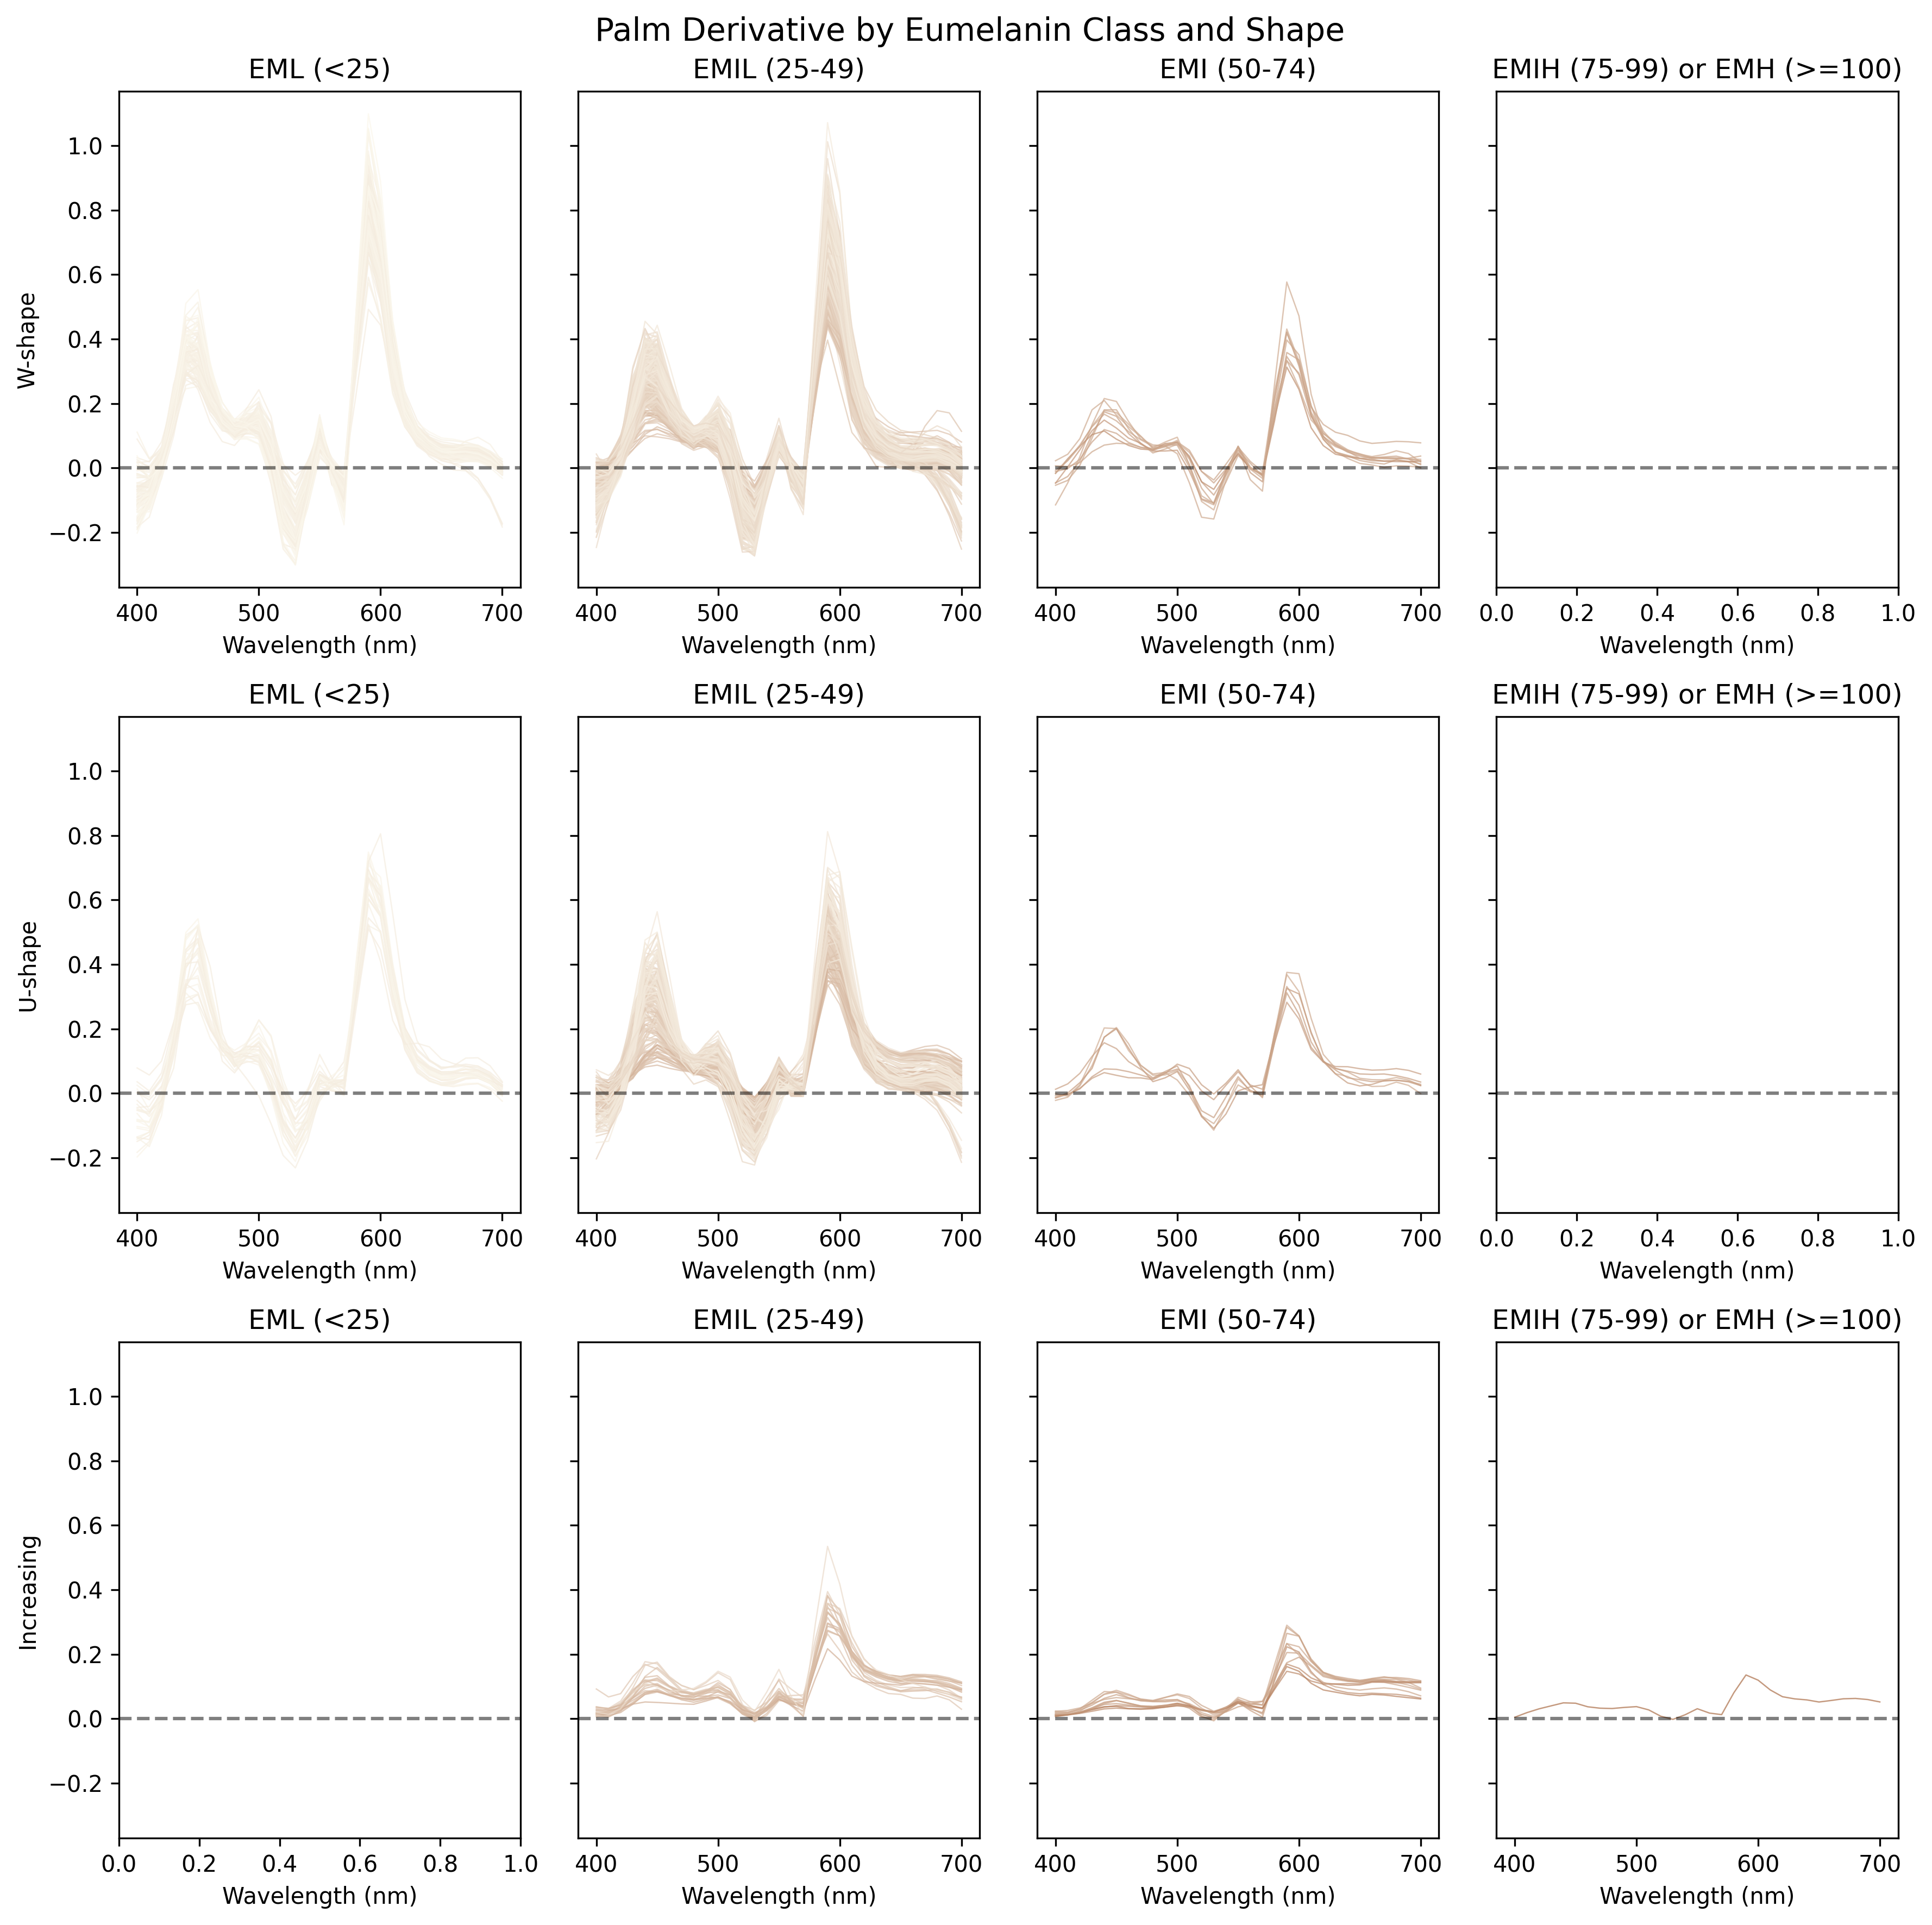
We can classify spectral shapes based on the first derivative of skin reflectance. Within the 500–600 nm wavelength range, we apply the following criteria:
Monotonically Increasing: The first derivative remains positive.
U-shape: The derivative exhibits exactly one zero-crossing from negative to positive, indicating a single valley.
W-shape: The derivative exhibits two zero-crossings from negative to positive, indicating two distinct valleys.
2.1 Frequency and proportion tables
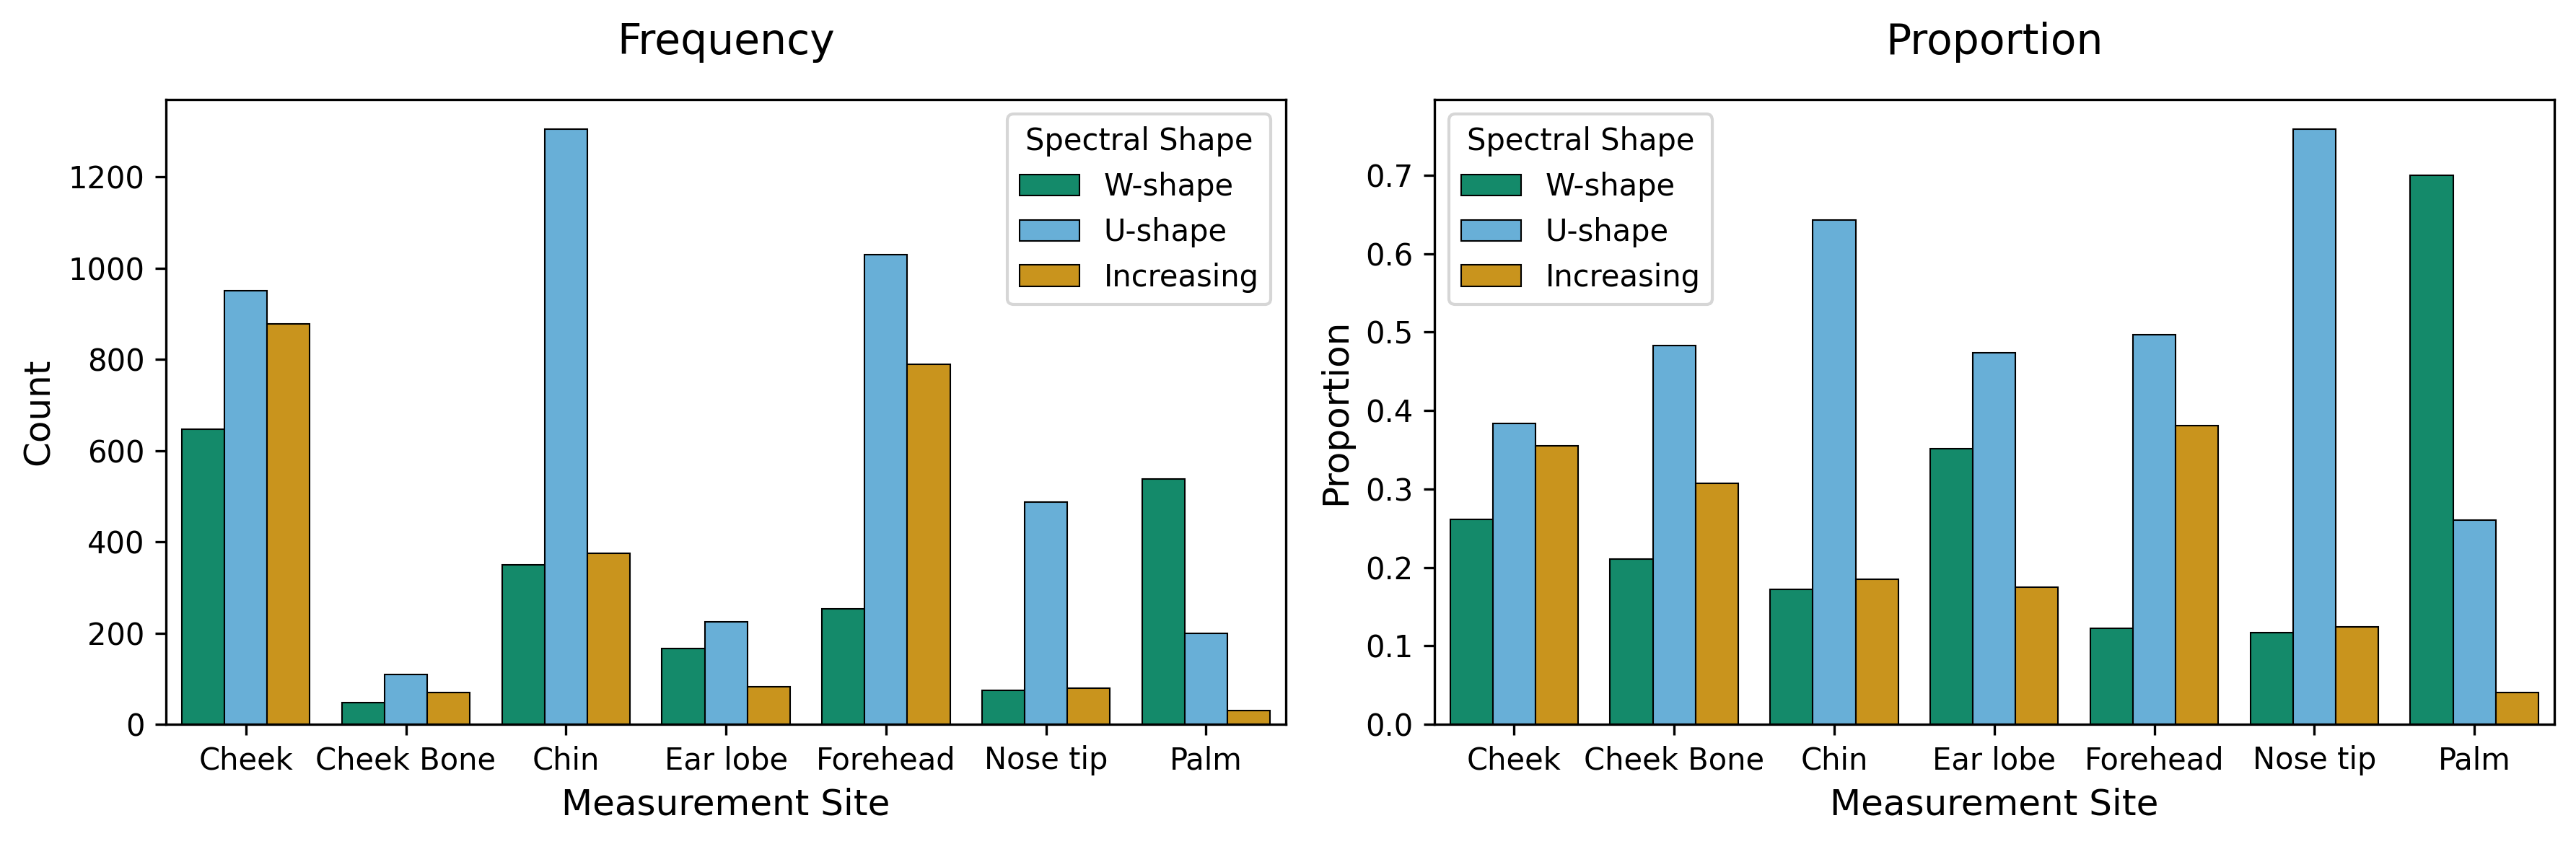
Frequency table of shape classifications for face and palm sites:
| Shape | W-shape | U-shape | Increasing |
|---|---|---|---|
| Site | |||
| Cheek | 647 | 950 | 878 |
| Cheek Bone | 48 | 110 | 70 |
| Chin | 350 | 1305 | 375 |
| Ear lobe | 167 | 225 | 83 |
| Forehead | 253 | 1030 | 789 |
| Nose tip | 75 | 488 | 80 |
| Palm | 538 | 200 | 31 |
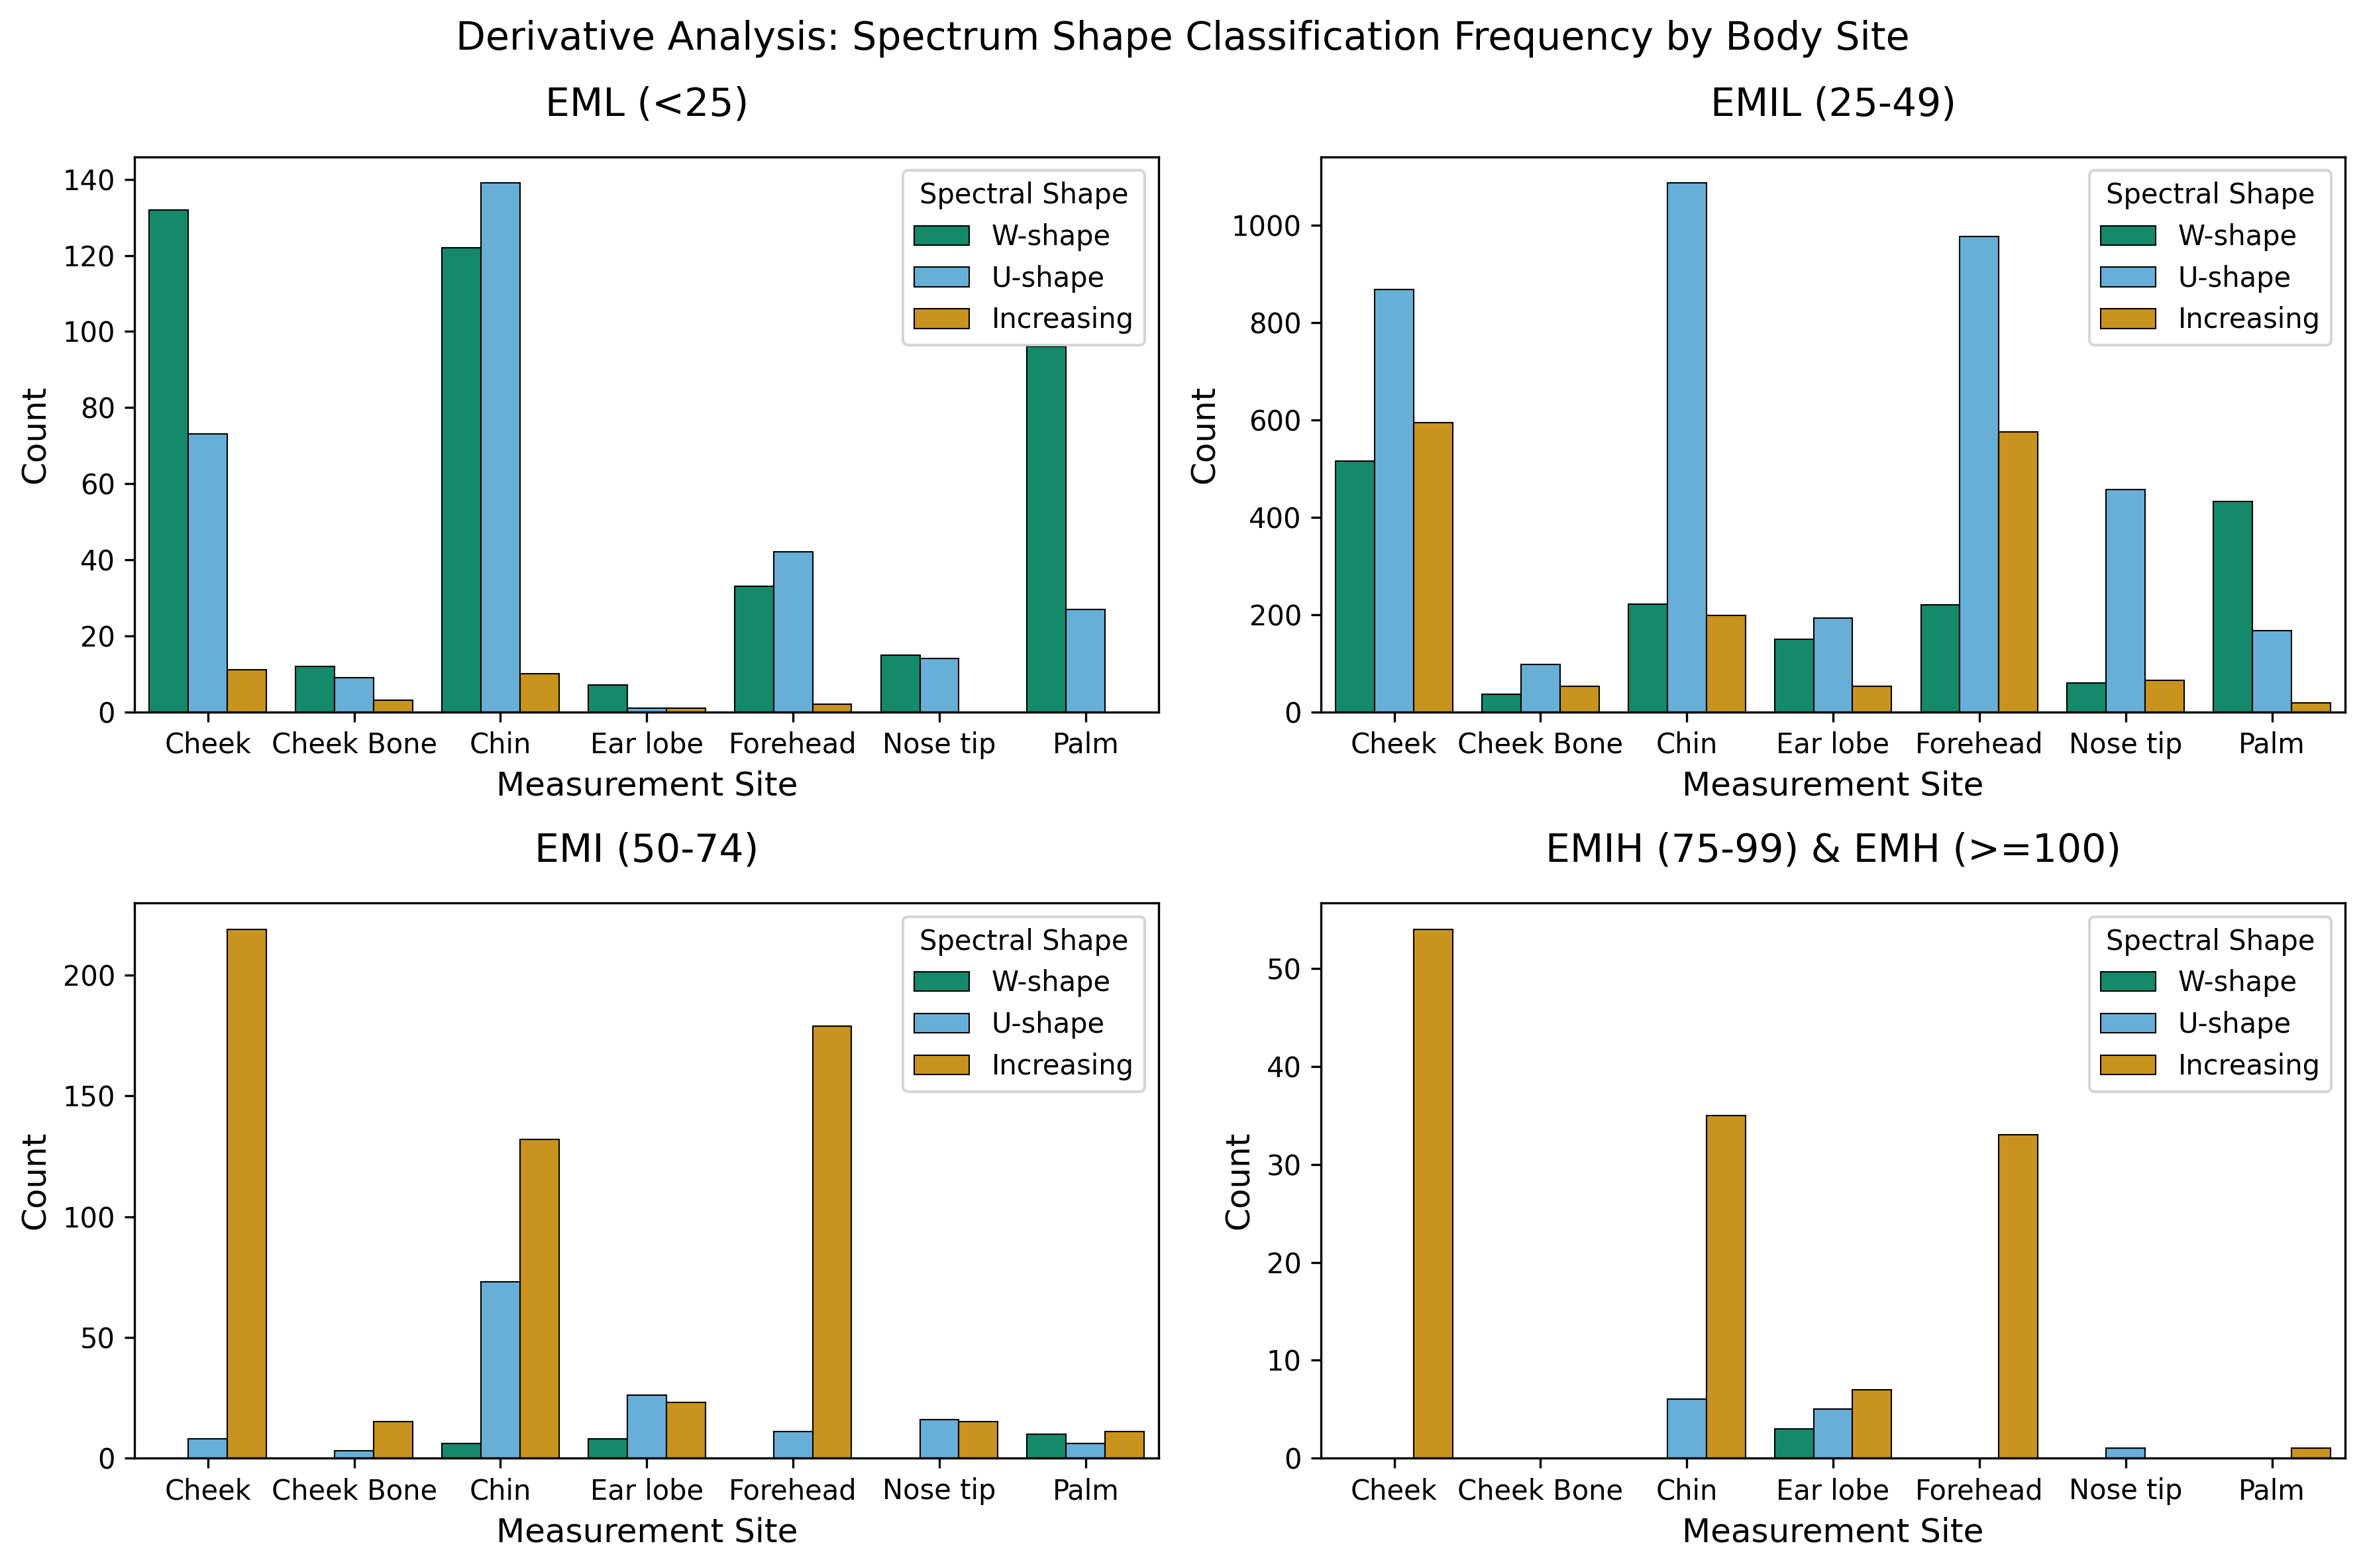
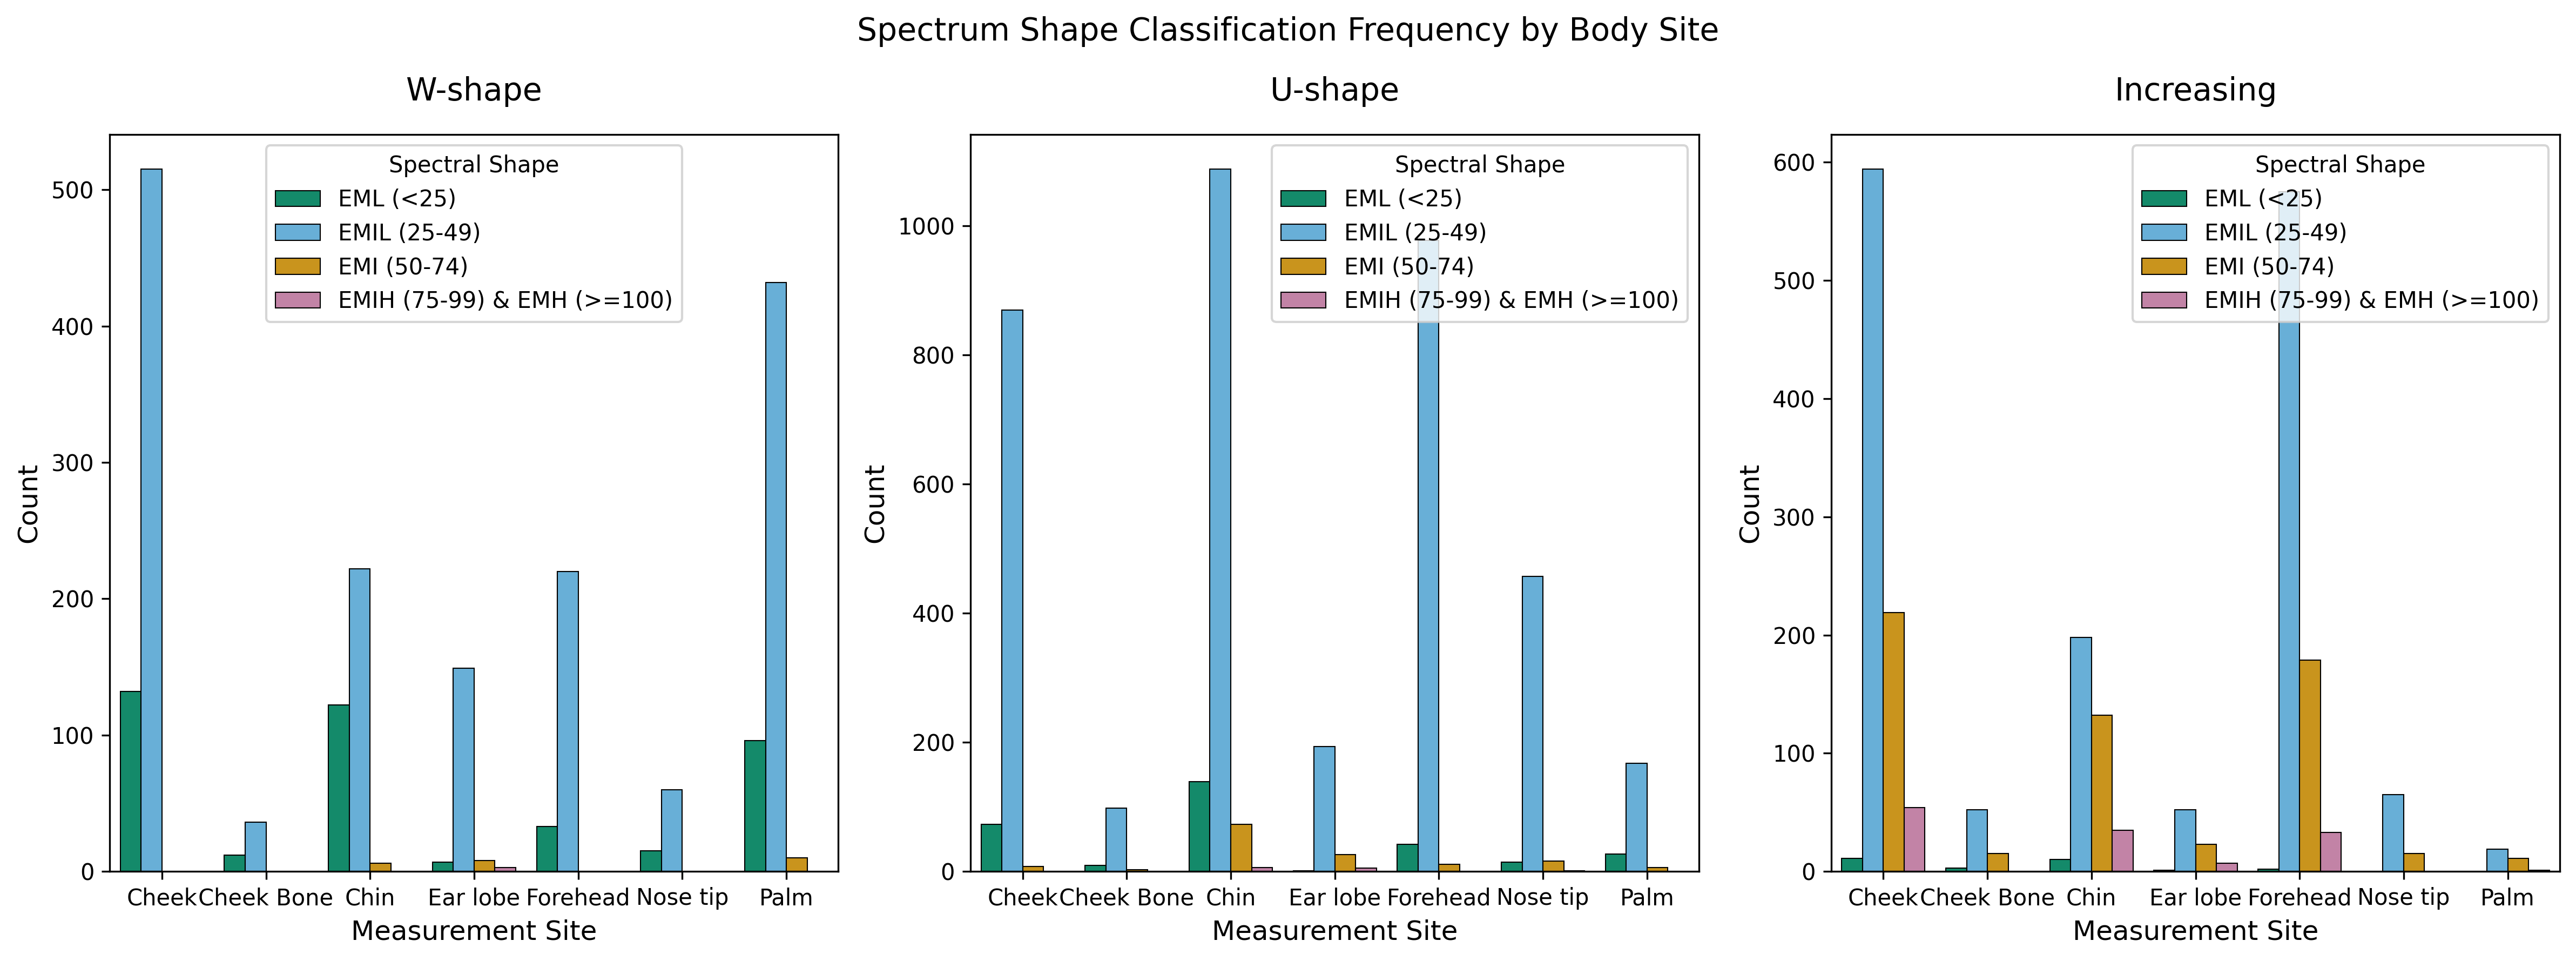
Frequency table of shape classifications for face and palm sites by eumelanin class:
| Shape | W-shape | U-shape | Increasing | |
|---|---|---|---|---|
| Site | Eumelanin Class | |||
| Cheek | EML (<25) | 132 | 73 | 11 |
| EMIL (25-49) | 515 | 869 | 594 | |
| EMI (50-74) | 0 | 8 | 219 | |
| EMIH (75-99) & EMH (>=100) | 0 | 0 | 54 | |
| Cheek Bone | EML (<25) | 12 | 9 | 3 |
| EMIL (25-49) | 36 | 98 | 52 | |
| EMI (50-74) | 0 | 3 | 15 | |
| Chin | EML (<25) | 122 | 139 | 10 |
| EMIL (25-49) | 222 | 1087 | 198 | |
| EMI (50-74) | 6 | 73 | 132 | |
| EMIH (75-99) & EMH (>=100) | 0 | 6 | 35 | |
| Ear lobe | EML (<25) | 7 | 1 | 1 |
| EMIL (25-49) | 149 | 193 | 52 | |
| EMI (50-74) | 8 | 26 | 23 | |
| EMIH (75-99) & EMH (>=100) | 3 | 5 | 7 | |
| Forehead | EML (<25) | 33 | 42 | 2 |
| EMIL (25-49) | 220 | 977 | 575 | |
| EMI (50-74) | 0 | 11 | 179 | |
| EMIH (75-99) & EMH (>=100) | 0 | 0 | 33 | |
| Nose tip | EML (<25) | 15 | 14 | 0 |
| EMIL (25-49) | 60 | 457 | 65 | |
| EMI (50-74) | 0 | 16 | 15 | |
| EMIH (75-99) & EMH (>=100) | 0 | 1 | 0 | |
| Palm | EML (<25) | 96 | 27 | 0 |
| EMIL (25-49) | 432 | 167 | 19 | |
| EMI (50-74) | 10 | 6 | 11 | |
| EMIH (75-99) & EMH (>=100) | 0 | 0 | 1 |
Proportion table of shape classifications for face and palm sites:
| Shape | W-shape | U-shape | Increasing |
|---|---|---|---|
| Site | |||
| Cheek | 0.261 | 0.384 | 0.355 |
| Cheek Bone | 0.211 | 0.482 | 0.307 |
| Chin | 0.172 | 0.643 | 0.185 |
| Ear lobe | 0.352 | 0.474 | 0.175 |
| Forehead | 0.122 | 0.497 | 0.381 |
| Nose tip | 0.117 | 0.759 | 0.124 |
| Palm | 0.700 | 0.260 | 0.040 |
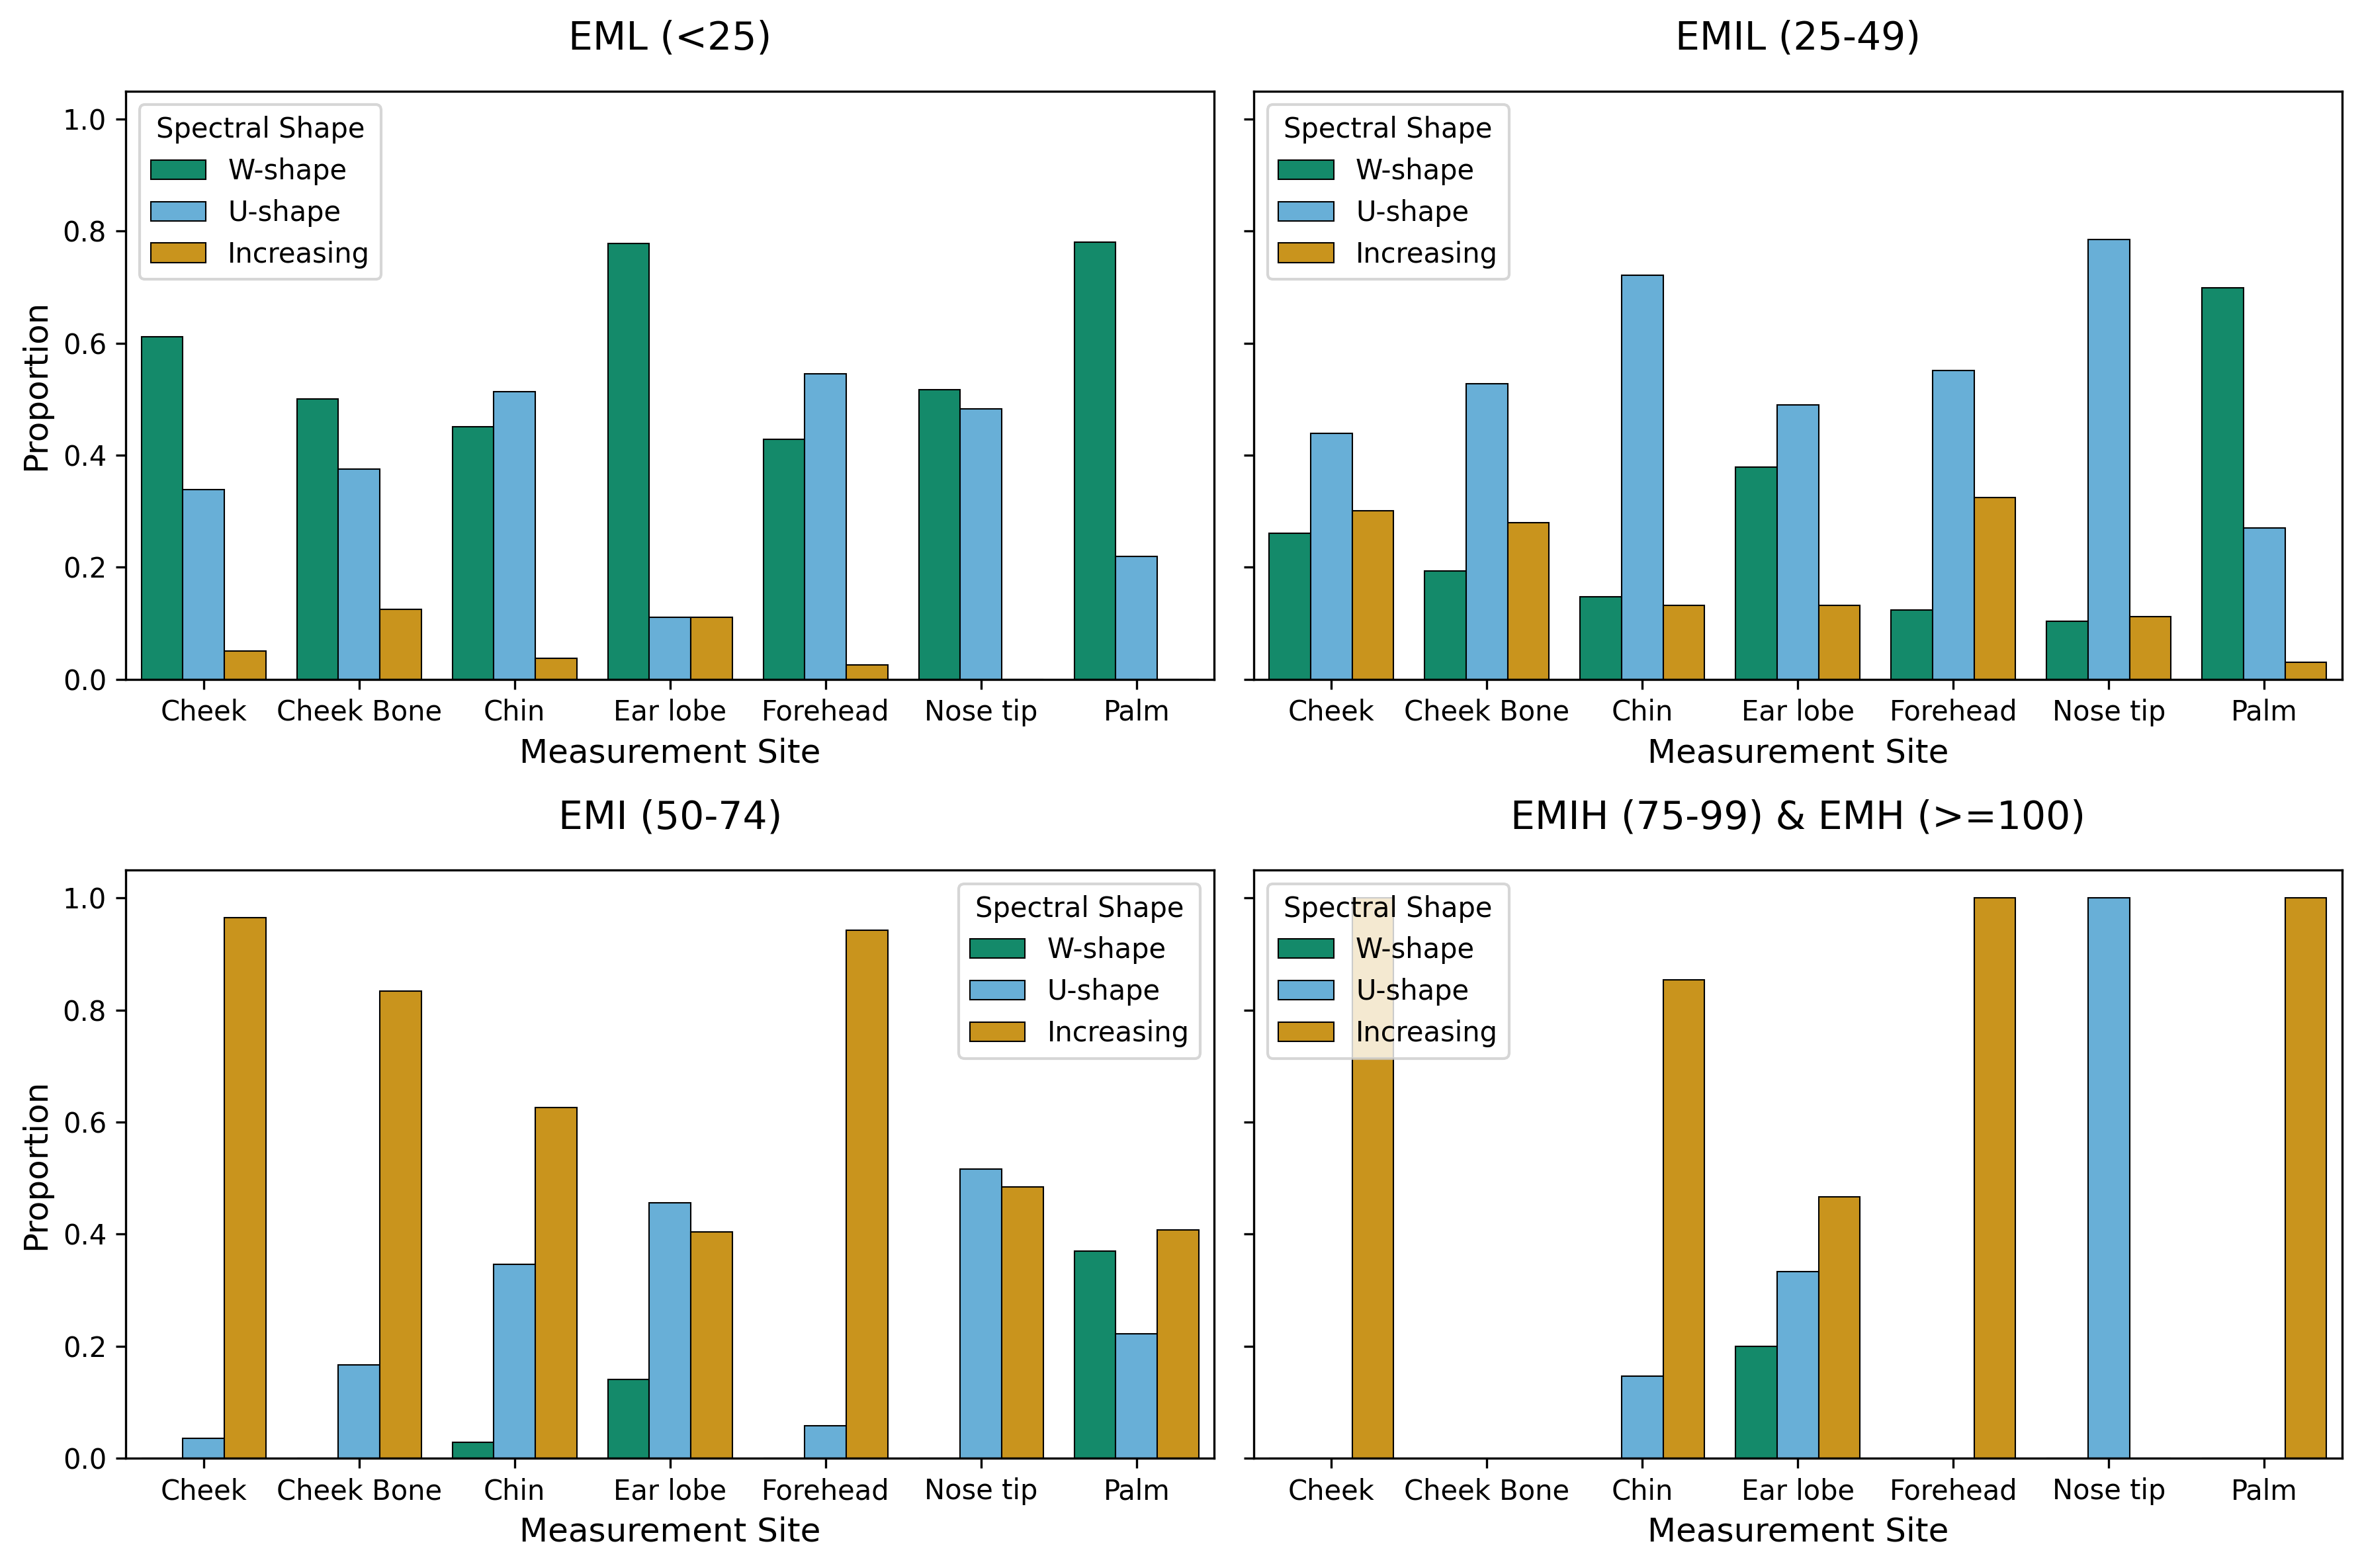
Proportion table of shape classifications for face and palm sites by eumelanin class:
| Shape | W-shape | U-shape | Increasing | Total Samples | |
|---|---|---|---|---|---|
| Site | Eumelanin Class | ||||
| Cheek | EML (<25) | 0.611 | 0.338 | 0.051 | 216 |
| EMIL (25-49) | 0.260 | 0.439 | 0.300 | 1978 | |
| EMI (50-74) | 0.000 | 0.035 | 0.965 | 227 | |
| EMIH (75-99) & EMH (>=100) | 0.000 | 0.000 | 1.000 | 54 | |
| Cheek Bone | EML (<25) | 0.500 | 0.375 | 0.125 | 24 |
| EMIL (25-49) | 0.194 | 0.527 | 0.280 | 186 | |
| EMI (50-74) | 0.000 | 0.167 | 0.833 | 18 | |
| Chin | EML (<25) | 0.450 | 0.513 | 0.037 | 271 |
| EMIL (25-49) | 0.147 | 0.721 | 0.131 | 1507 | |
| EMI (50-74) | 0.028 | 0.346 | 0.626 | 211 | |
| EMIH (75-99) & EMH (>=100) | 0.000 | 0.146 | 0.854 | 41 | |
| Ear lobe | EML (<25) | 0.778 | 0.111 | 0.111 | 9 |
| EMIL (25-49) | 0.378 | 0.490 | 0.132 | 394 | |
| EMI (50-74) | 0.140 | 0.456 | 0.404 | 57 | |
| EMIH (75-99) & EMH (>=100) | 0.200 | 0.333 | 0.467 | 15 | |
| Forehead | EML (<25) | 0.429 | 0.545 | 0.026 | 77 |
| EMIL (25-49) | 0.124 | 0.551 | 0.324 | 1772 | |
| EMI (50-74) | 0.000 | 0.058 | 0.942 | 190 | |
| EMIH (75-99) & EMH (>=100) | 0.000 | 0.000 | 1.000 | 33 | |
| Nose tip | EML (<25) | 0.517 | 0.483 | 0.000 | 29 |
| EMIL (25-49) | 0.103 | 0.785 | 0.112 | 582 | |
| EMI (50-74) | 0.000 | 0.516 | 0.484 | 31 | |
| EMIH (75-99) & EMH (>=100) | 0.000 | 1.000 | 0.000 | 1 | |
| Palm | EML (<25) | 0.780 | 0.220 | 0.000 | 123 |
| EMIL (25-49) | 0.699 | 0.270 | 0.031 | 618 | |
| EMI (50-74) | 0.370 | 0.222 | 0.407 | 27 | |
| EMIH (75-99) & EMH (>=100) | 0.000 | 0.000 | 1.000 | 1 |
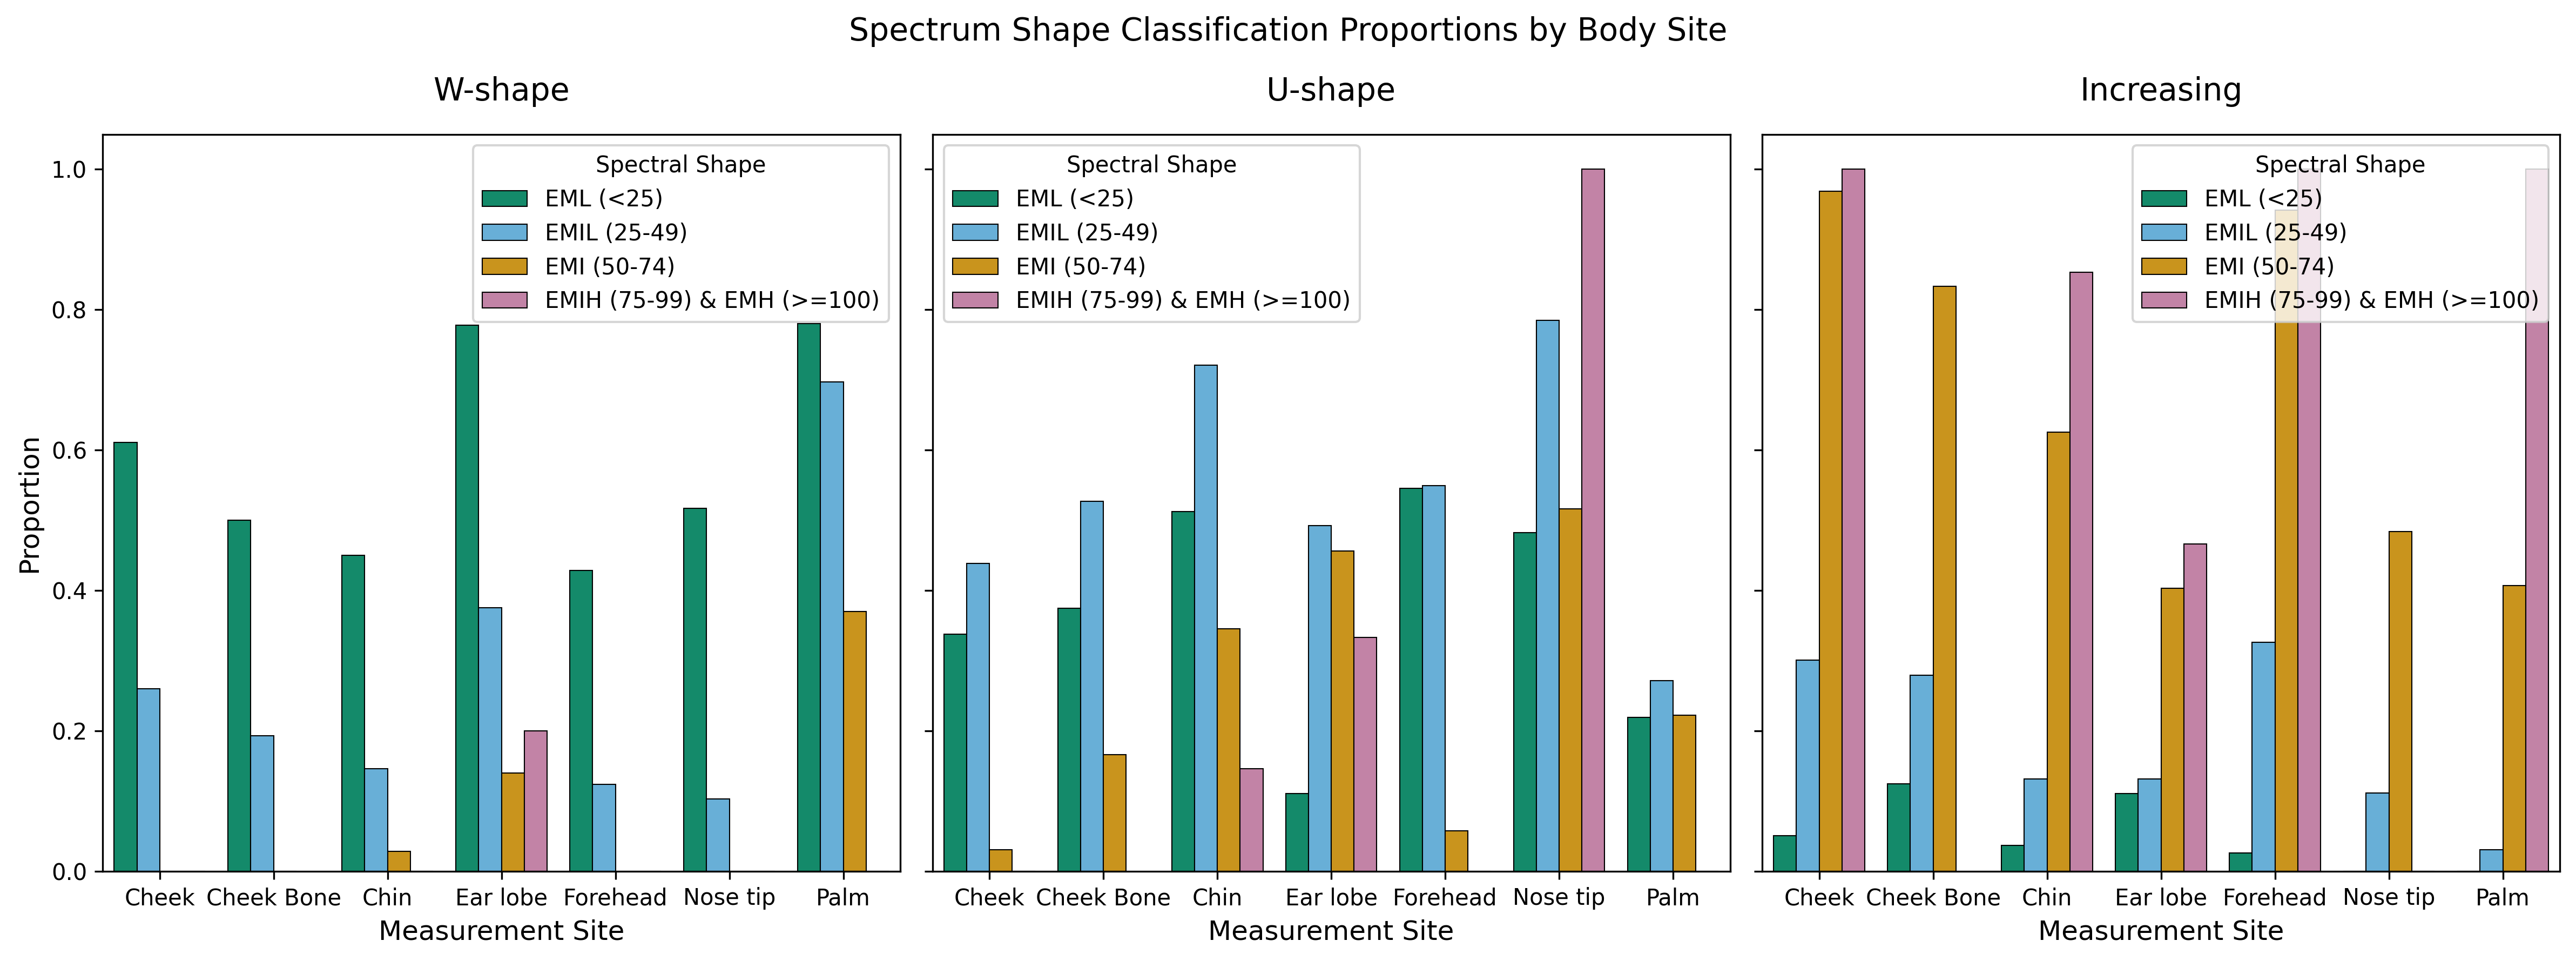
2.2 Frequency and Proportion figures
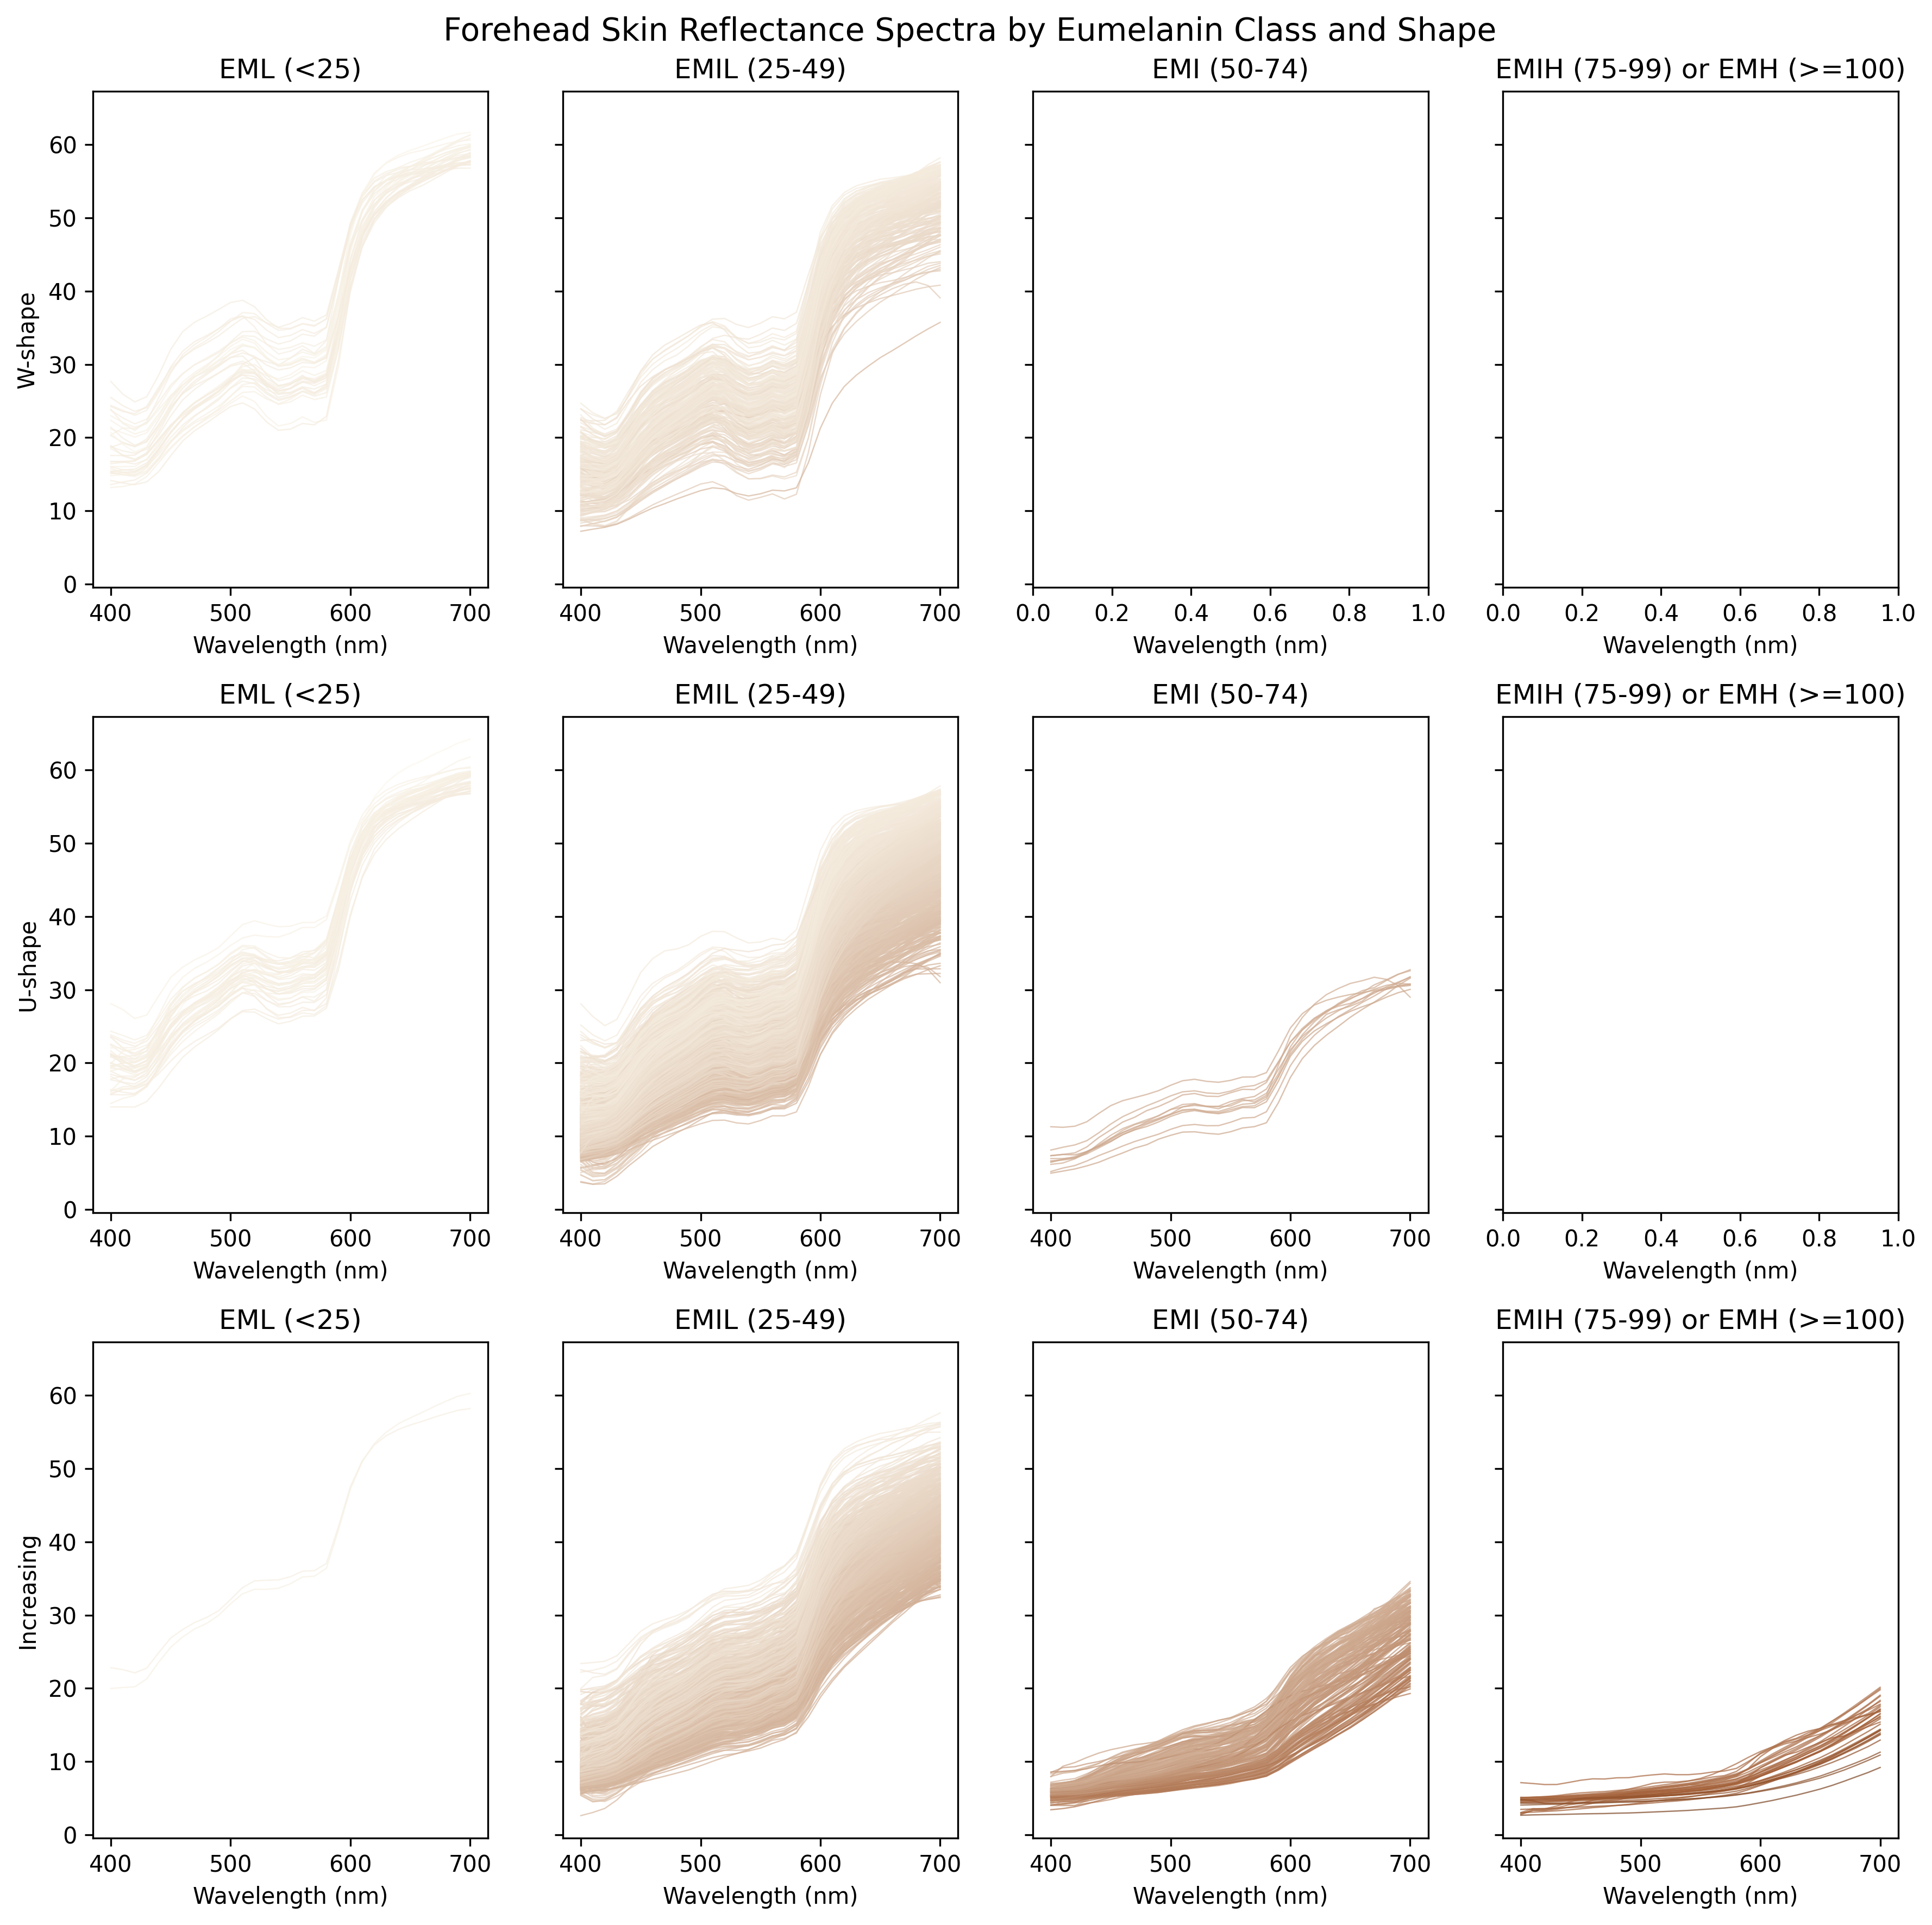
2.3 Skin reflectance spectra on forehead and palm
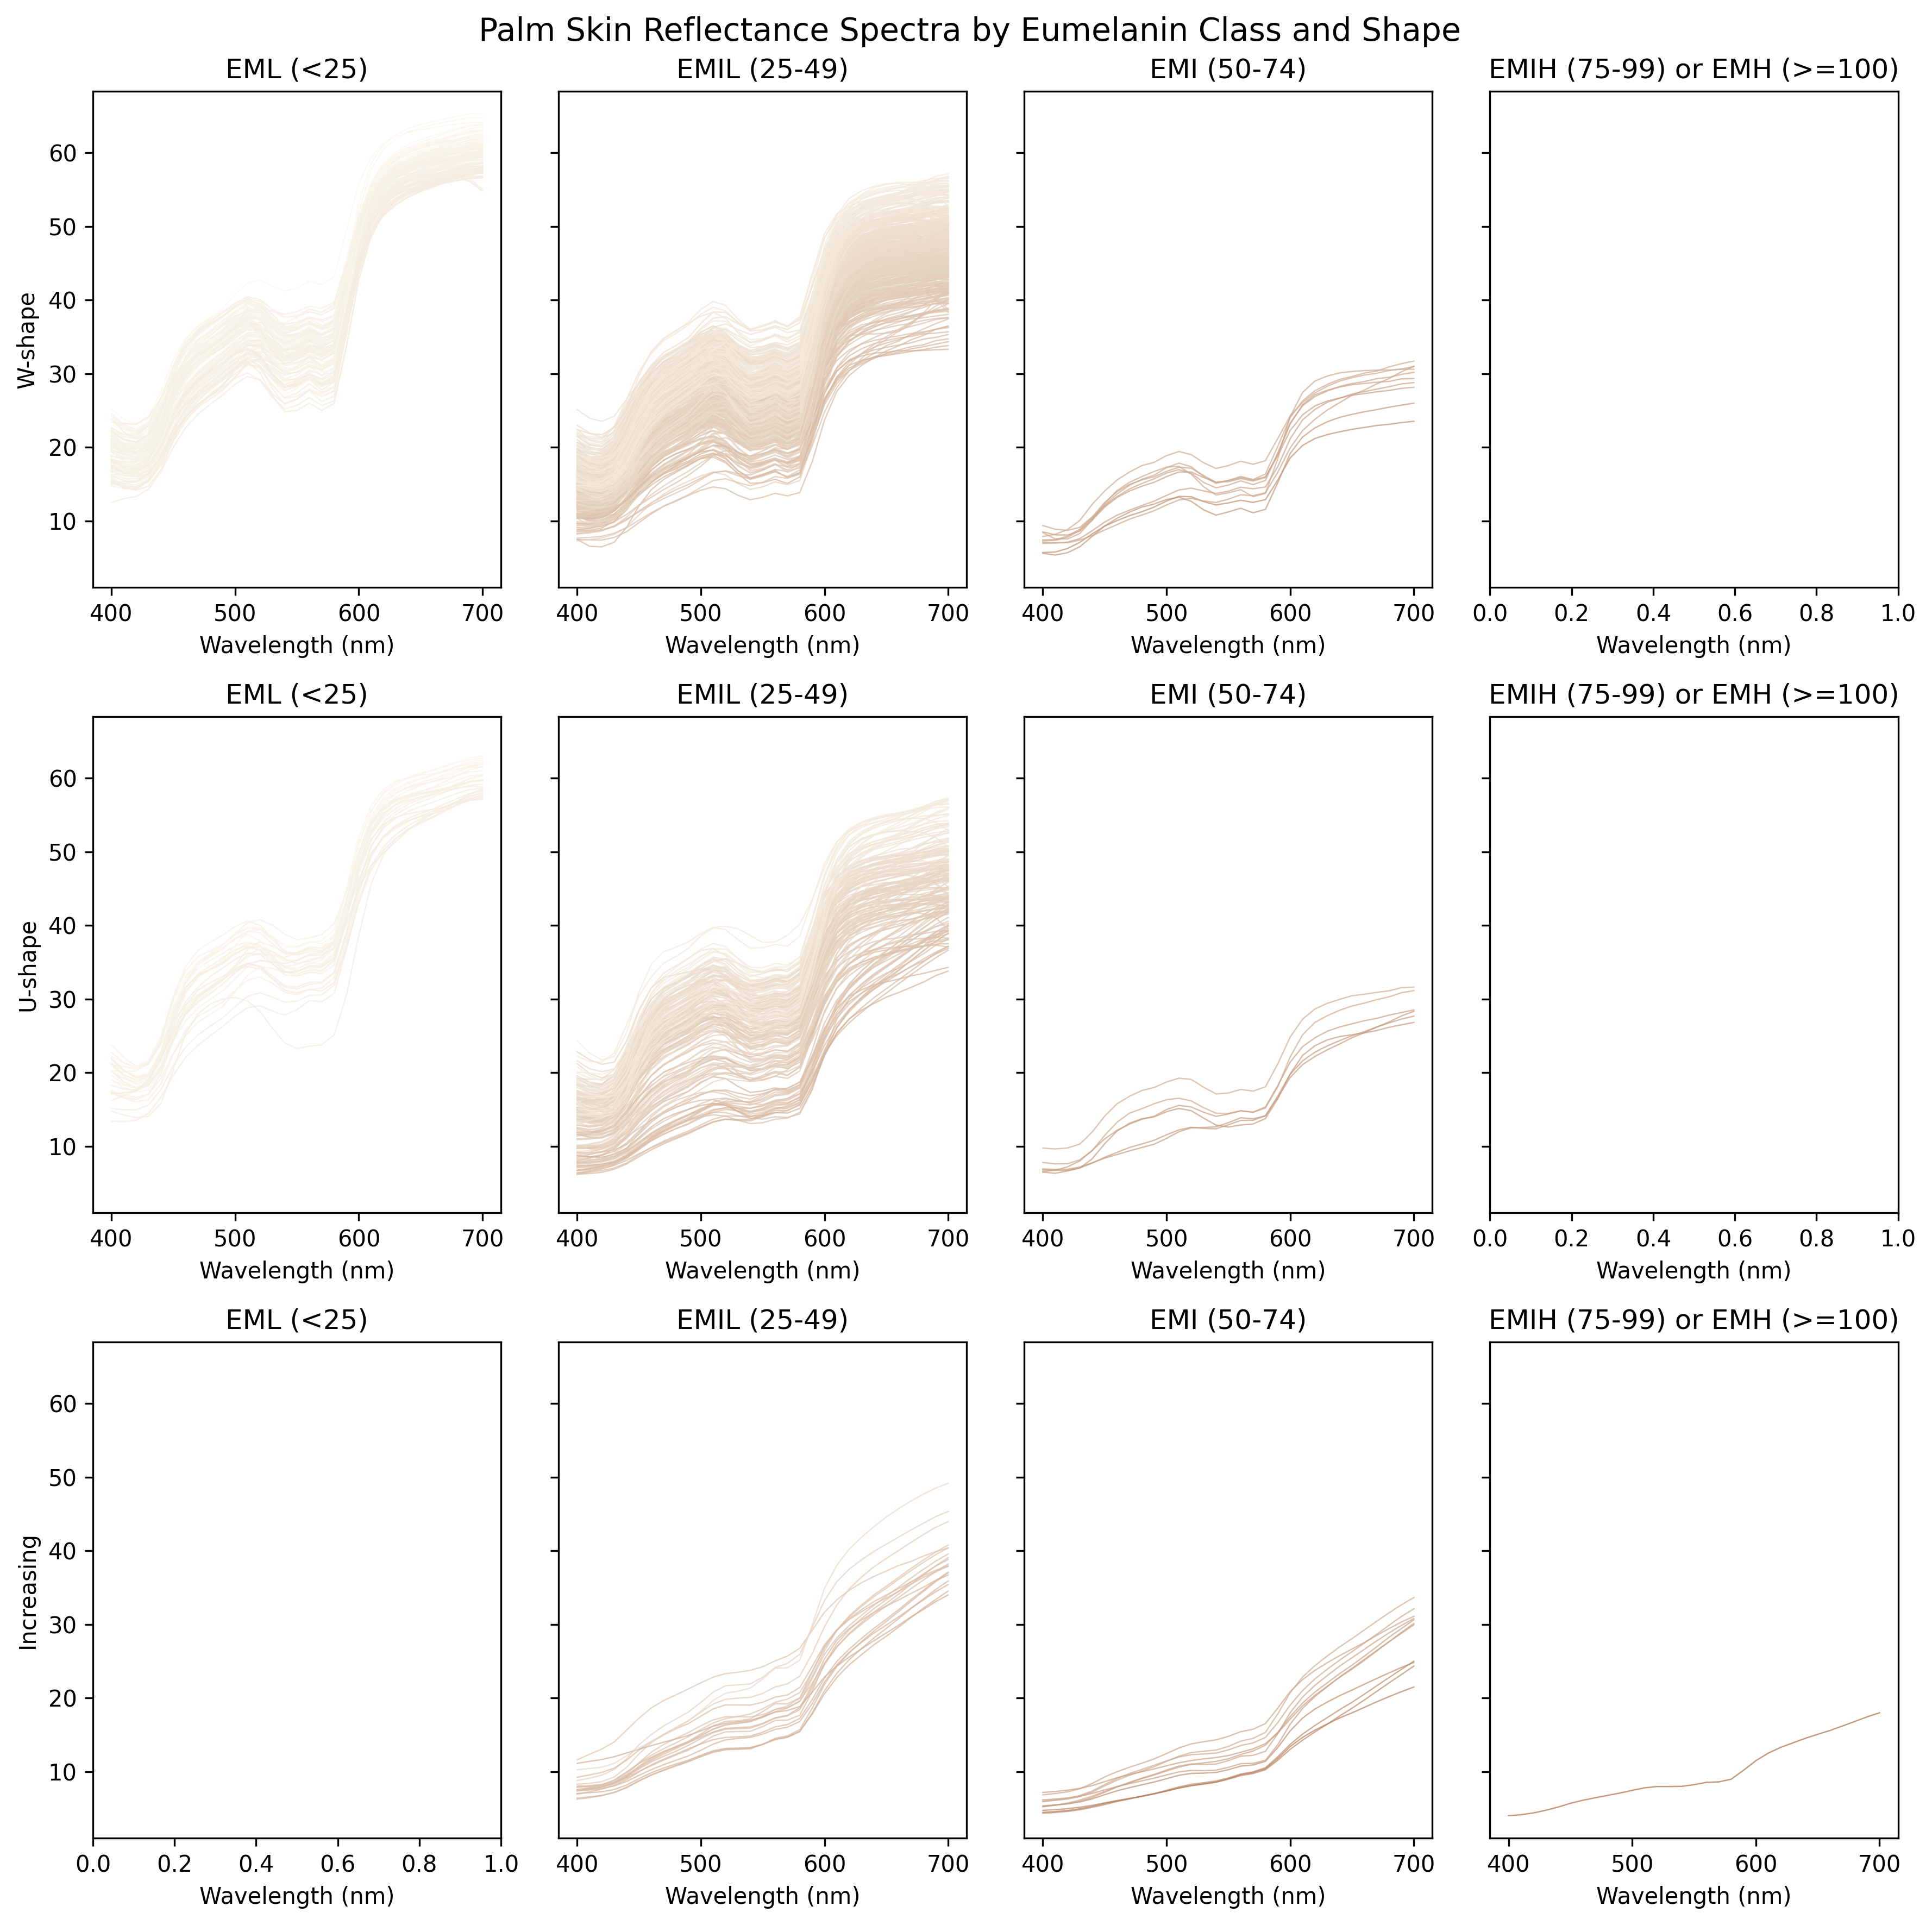
2.4 First derivative on forehead and palm
2.5 Comparison of non-facial sites with the face
The manuscript uses the palm as the single non-facial comparison site. To support this choice, we compare every non-facial ISSA site with the pooled facial sites on three criteria:
- Spectral shape: proportions of W-shaped, U-shaped, and increasing spectra after derivative-based outlier removal, applied separately to the pooled facial sites and to each non-facial site, as above.
- Coupling to facial pigmentation: among participants measured at both a given site and the face, the slope and Pearson correlation of the site’s melanin index on the participant’s mean facial melanin index. This criterion uses all records before outlier removal.
- Sample size: the number of spectra after outlier removal and the number of contributing component datasets.
Participants are identified by (dataset, subject) pairs.
| Spectra (cleaned) | Datasets | W-shape | U-shape | Increasing | Paired participants (all records) | MI slope on face (all records) | MI correlation with face (all records) | |
|---|---|---|---|---|---|---|---|---|
| Site | ||||||||
| Face (pooled) | 7923 | 11 | 0.194 | 0.518 | 0.288 | NaN | NaN | NaN |
| Back of Hand | 1694 | 10 | 0.011 | 0.539 | 0.450 | 1715.0 | 0.917 | 0.848 |
| Inner arm | 1666 | 9 | 0.032 | 0.597 | 0.370 | 1690.0 | 0.653 | 0.774 |
| Neck | 1158 | 7 | 0.075 | 0.383 | 0.541 | 876.0 | 1.008 | 0.935 |
| Outer arm | 1609 | 9 | 0.022 | 0.351 | 0.626 | 1630.0 | 0.892 | 0.793 |
| Palm | 769 | 6 | 0.698 | 0.261 | 0.040 | 777.0 | 0.418 | 0.680 |
| Ring finger | 242 | 3 | 0.884 | 0.103 | 0.012 | 243.0 | 0.619 | 0.546 |
The palm differs most clearly from the face among the well-sampled non-facial sites:
- W-shaped spectra account for 69.8% of palm spectra, compared with 19.4% of the pooled facial spectra and 1.1–7.5% at the back of the hand, arms, and neck. These hair-bearing sites are dominated by U-shaped and increasing spectra.
- Palm pigmentation is the least coupled to facial pigmentation: the palm melanin index increases by 0.42 units per unit of mean facial melanin index (correlation 0.68, 777 participants), whereas the slopes for the other non-facial sites range from 0.62 to 1.01.
- The ring finger shows a similar contrast in shape, but it has only 242 cleaned spectra from three component datasets, compared with 769 palm spectra from six.
2.6 Key observations
The skin reflectance spectra of lighter skin tones predominantly exhibit a W-shape or U-shape profile, whereas darker skin tones generally display an increasing shape.
The proportion of the W-shape decreases as the Melanin Index (MI) rises. In contrast, the proportion of the U-shape peaks within the EMIL class (\(25 \leq \mathrm{MI} < 50\)), and the increasing shape becomes more dominant at higher MI values.
Spectral shape distributions vary significantly across different body sites.
Among the non-facial sites, the palm differs most clearly from the face in both spectral shape and pigmentation, which motivates its use as the single non-facial comparison site.